We can't find the internet
Attempting to reconnect
Something went wrong
Hang in there while we get back on track
£135.76
This is the most expensive it has ever been. Walk away.
£136 today · previous high £136 · all-time low £135
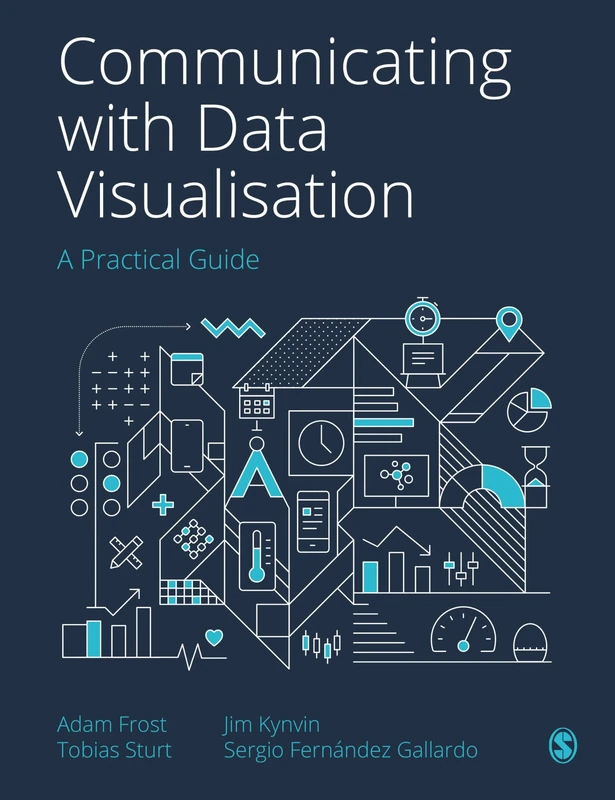
Sage Publishing Sage Communicating with Data Visualisation - Practical Guide
We'll watch every seller, every day. One email when your price arrives.
Price History & Forecast
Grey patches = out of stock. Cheaper = lower on the chart. Hover for exact prices.
Last 32 days · 32 data points (no recent data)
NEW HERE?
Amazon shows you one price. We show you all of them.
Tosheroon watches Amazon prices so you don't have to. Every product on Amazon has a price history — we make it visible. Set the price you'd actually pay, and we'll email you the second it gets there. No app, no account, one email.
WHAT'S ON THIS PAGE
when this has been cheap or pricey
where the price is heading next
all-time high & low, recent range
name your number, we'll email you
Price Distribution
Price distribution over 32 days • 2 price levels
Price Analysis
Most common price: £136 (26 days, 81.3%)
Price range: £135 - £136
Price levels: 2 different prices over 32 days
Description
Key Features
Learn to transform raw spreadsheets into compelling visual stories through a step-by-step guide.
Master various formats including static charts, maps, interactive infographics, and motion graphics.
Utilize a proven four-step framework to create engaging and innovative data visualisations.
Discover how to find human stories within complex datasets to better connect with your audience.
Apply techniques developed from Guardian masterclasses, workshops, and seminars to your work.
Design clear and persuasive visuals that help your audience understand and remember your data.
Product Specifications
- Brand
- Sage Publishing
- Format
- paperback
- ASIN
- 1529743761
- Domain
- Amazon UK
- Release Date
- 06 December 2021
- Listed Since
- 31 May 2021
Barcode
No barcode data available
Similar Products You Might Like
Communicating with Data Visualisation: A Practical Guide
Sage Publishing
Sage Data Visualisation: A Handbook for Data Driven Design
Sage Publishing
Data Visualization for People of All Ages (AK Peters Visualization Series)
Routledge
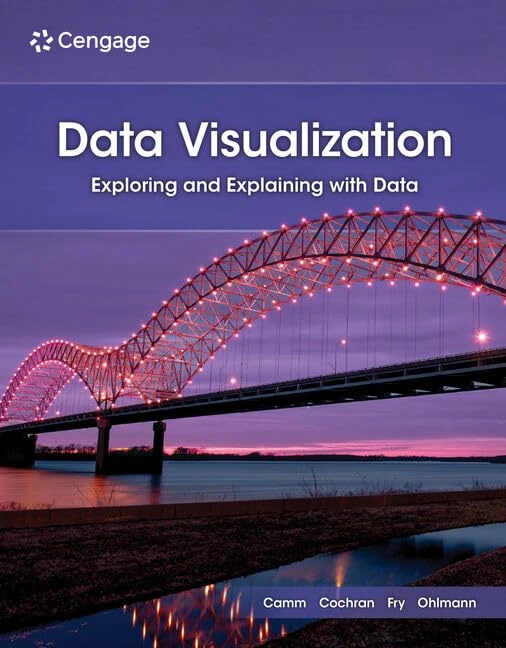
Data Visualization: Exploring and Explaining with Data
Cengage Learning
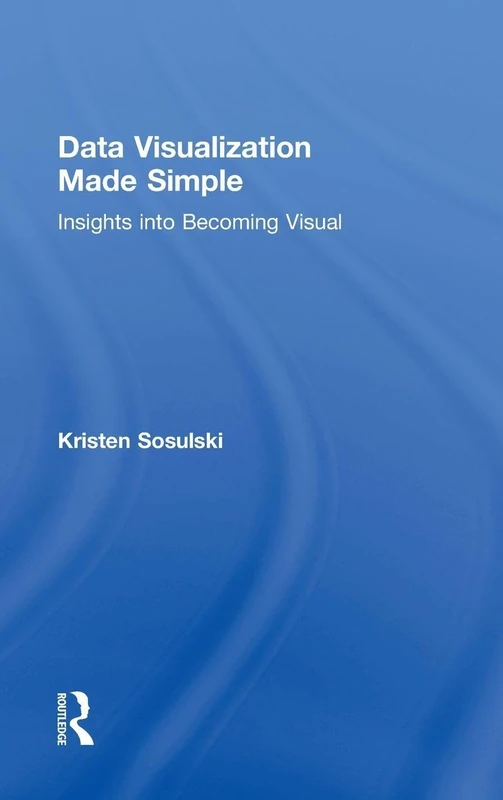
Data Visualization Made Simple - Routledge Practical Guide
Routledge
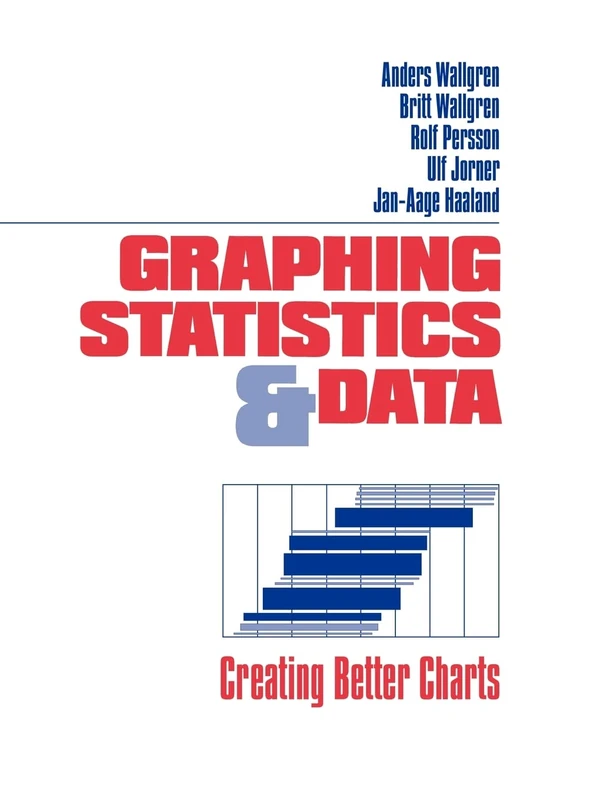
Sage Publications Graphing Statistics & Data Book
Sage Publishing
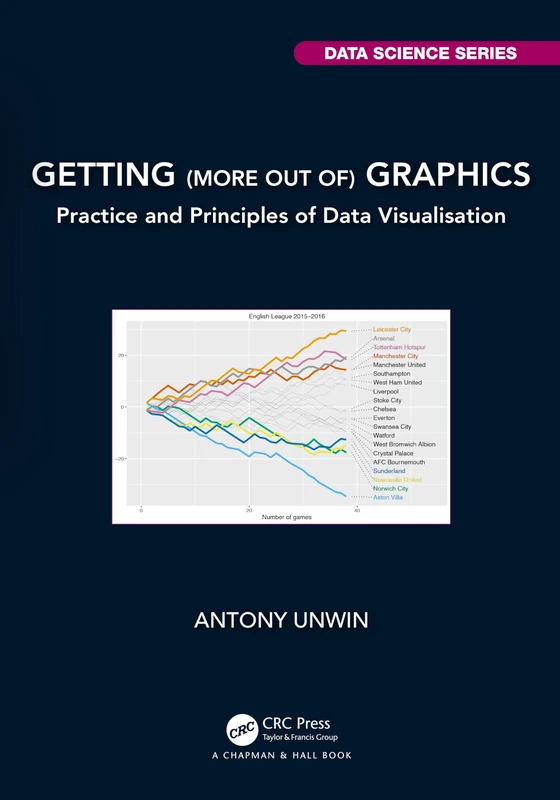
Getting (more out of) Graphics: Practice and Principles of Data Visualisation (Chapman & Hall/CRC Data Science Series)
Chapman and Hall/CRC
Graphing Data: Techniques for Display and Analysis: 36 (Applied Social Research Methods)
Sage Publishing
Graphing Data: Techniques for Display and Analysis: 36 (Applied Social Research Methods)
Sage Publishing
Graphical Data Analysis with R (Chapman & Hall/CRC The R Series)
Chapman and Hall/CRC
Value-Driven Data: Identifying, Communicating and Delivering Effective Business Solutions with Data
Kogan Page

Dataproof Your School: How to use assessment data effectively (Corwin Ltd)
Sage Publishing
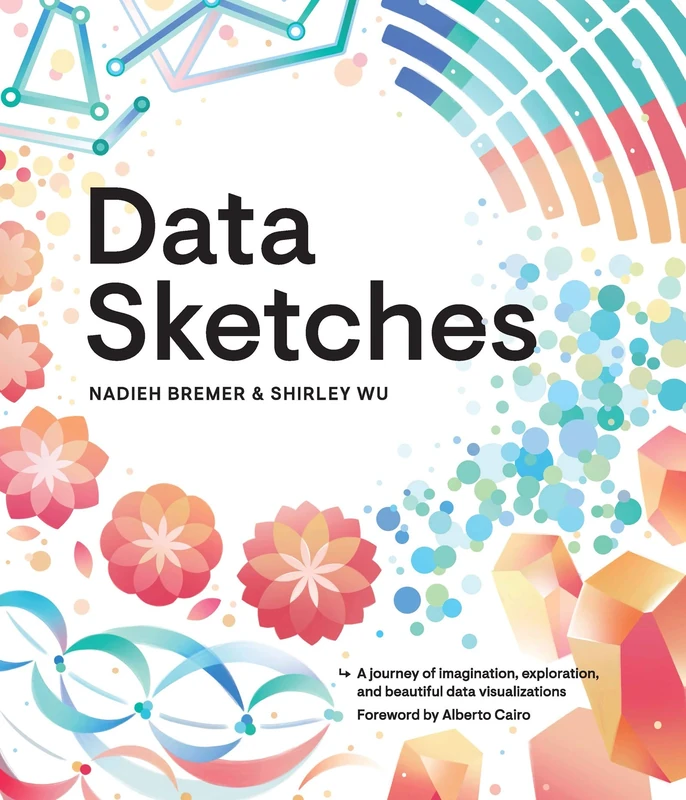
Data Sketches - AK Peters Visualization Series Book
CRC Press
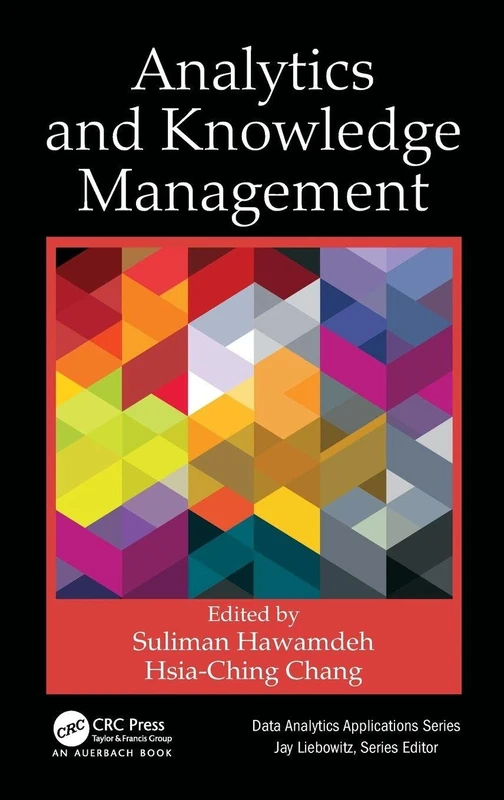
Analytics and Knowledge Management (Data Analytics Applications)
CRC Press
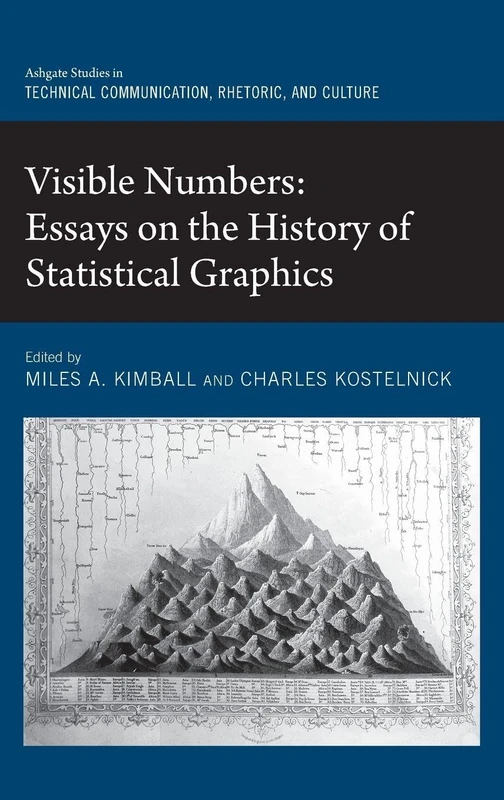
Visible Numbers: Essays on the History of Statistical Graphics (Routledge Studies in Technical Communication, Rhetoric, and Culture)
Routledge
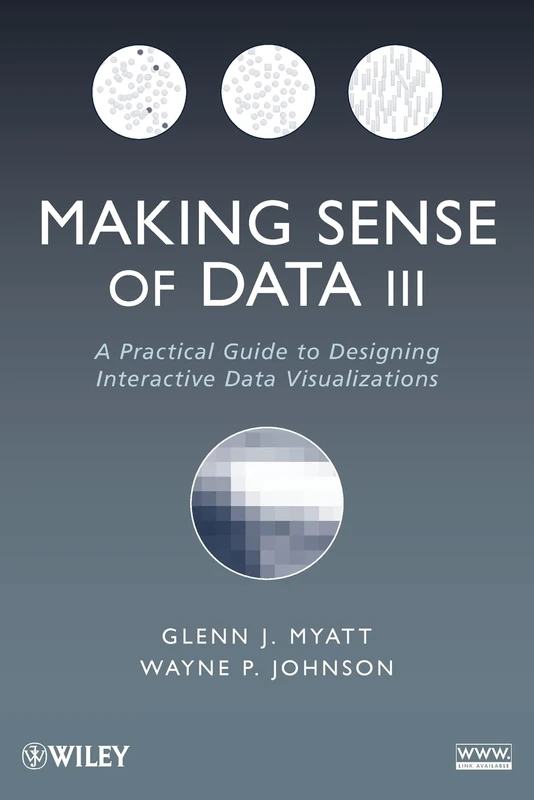
Making Sense of Data III: A Practical Guide to Designing Interactive Data Visualizations: 3
Wiley
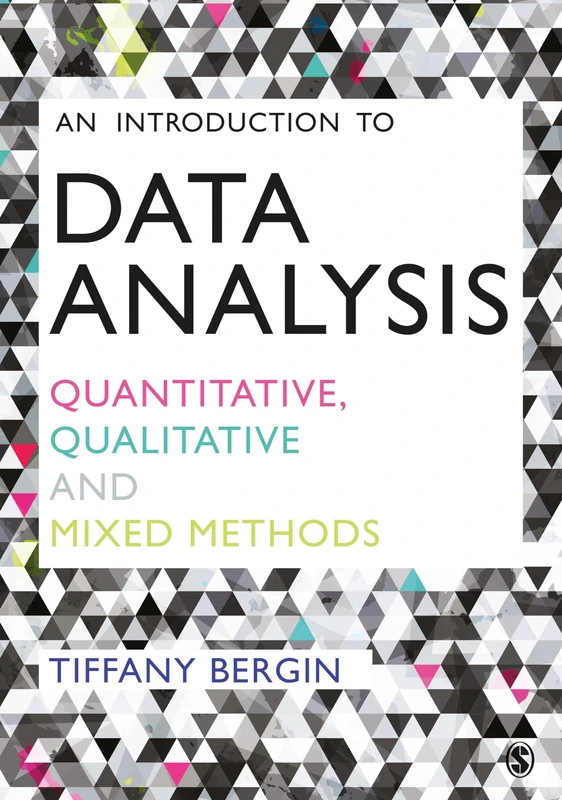
An Introduction to Data Analysis: Quantitative, Qualitative and Mixed Methods
Sage Publishing
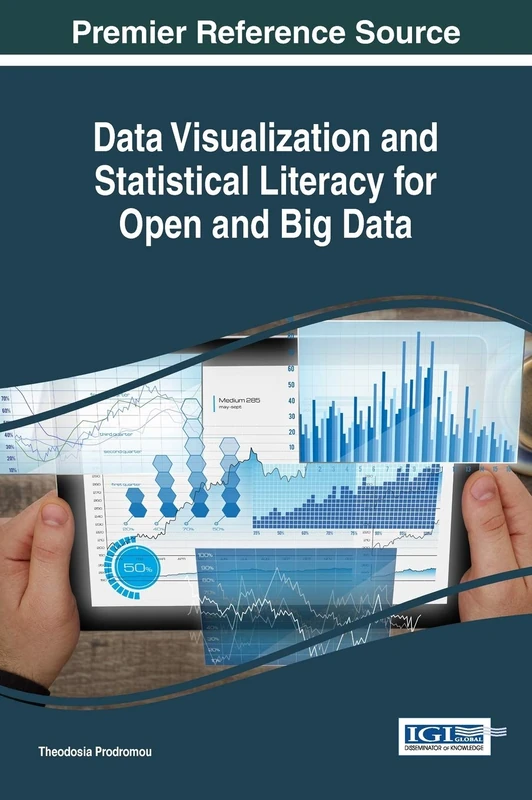
Data Visualization and Statistical Literacy for Open and Big Data (Advances in Data Mining and Database Management)
Information Science Reference

Interactive Data Visualization: Foundations, Techniques, and Applications, Second Edition (360 Degree Business)
CRC Press
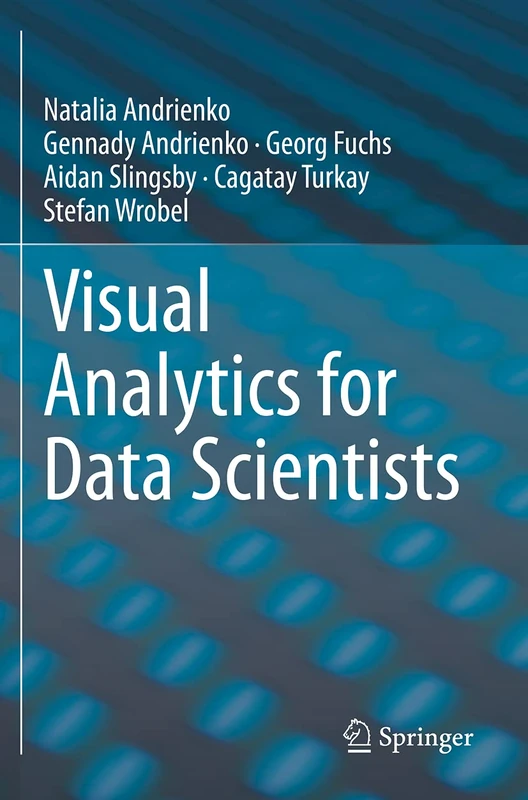
Visual Analytics for Data Scientists
Springer
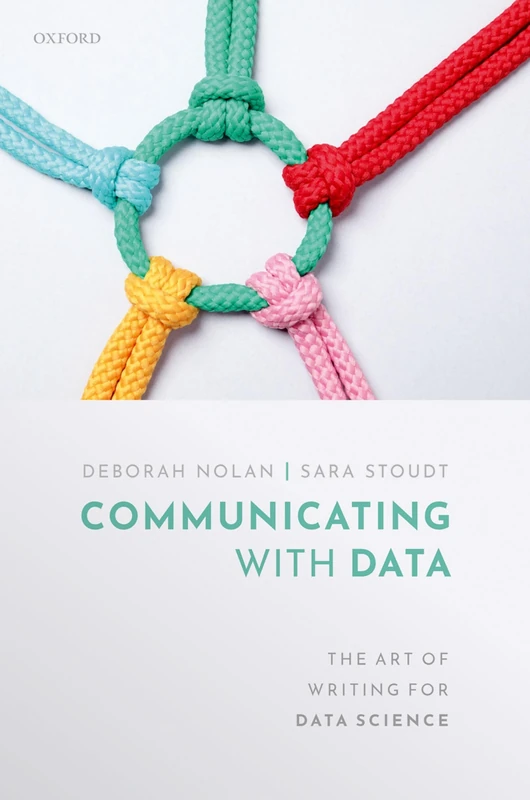
Communicating with Data: The Art of Writing for Data Science
Oxford University Press