We can't find the internet
Attempting to reconnect
Something went wrong
Hang in there while we get back on track
£120.62
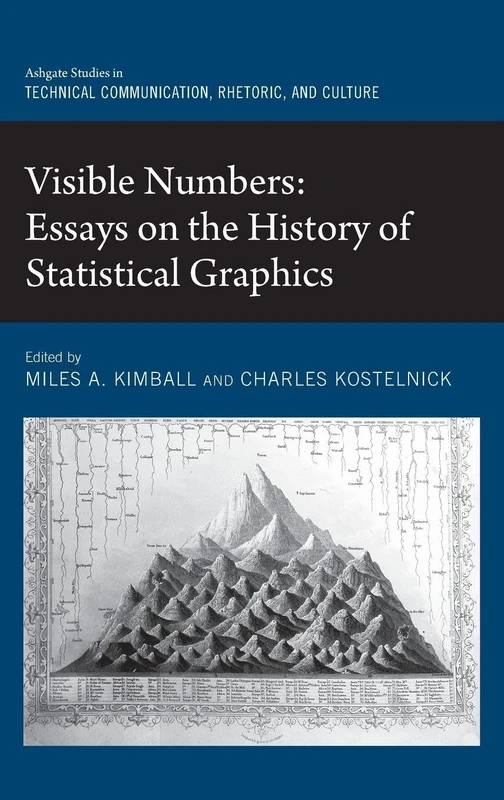
Routledge Visible Numbers: Essays on the History of Statistical Graphics (Routledge Studies in Technical Communication, Rhetoric, and Culture)
Price data last checked 28 day(s) ago - will refresh soon
We'll watch every seller, every day. One email when your price arrives.
It has never been this cheap. We have no record of a lower price.
£121 today · cheaper than every other day in the last 3 months
NEW HERE?
Amazon shows you one price. We show you all of them.
Tosheroon watches Amazon prices so you don't have to. Every product on Amazon has a price history — we make it visible. Set the price you'd actually pay, and we'll email you the second it gets there. No app, no account, one email.
WHAT'S ON THIS PAGE
when this has been cheap or pricey
where the price is heading next
all-time high & low, recent range
name your number, we'll email you
Price History & Forecast
Grey patches = out of stock. Cheaper = lower on the chart. Hover for exact prices.
Last 63 days · 63 data points (no recent data)
Price Distribution
Price distribution over 63 days • 1 price levels
Price Analysis
Most common price: £121 (63 days, 100.0%)
Price range: £121 - £121
Price levels: 1 different prices over 63 days
Description
Product Specifications
- Brand
- Routledge
- Format
- hardcover
- ASIN
- 1409448754
- Domain
- Amazon UK
- Release Date
- 28 January 2016
- Listed Since
- 11 August 2015
Barcode
No barcode data available
Similar Products You Might Like
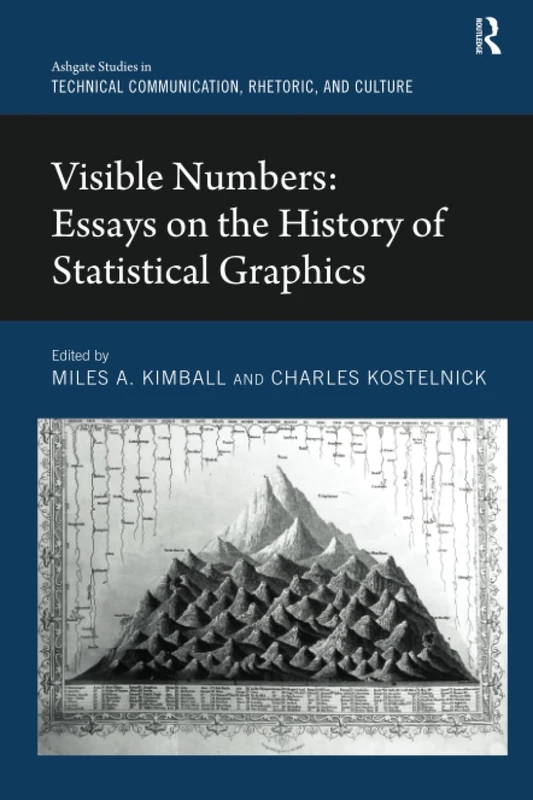
Visible Numbers: Essays on the History of Statistical Graphics (Routledge Studies in Technical Communication, Rhetoric, and Culture)
Routledge
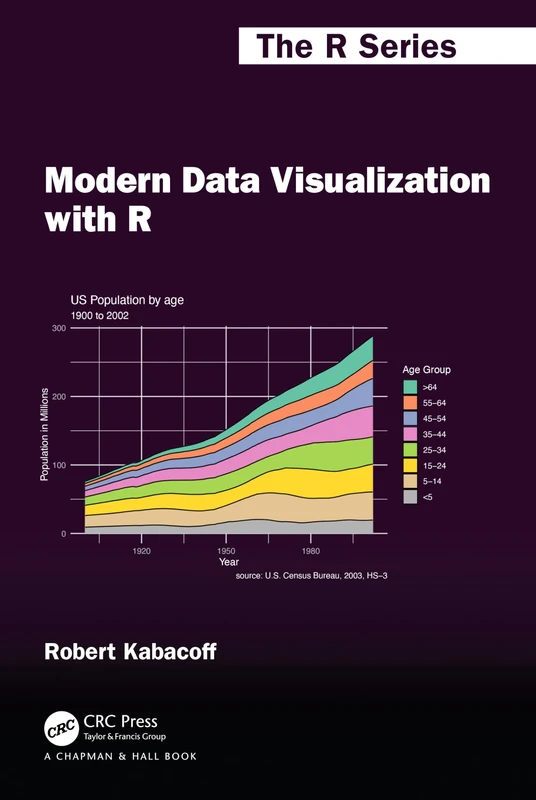
Modern Data Visualization with R (Chapman & Hall/CRC The R Series)
Chapman and Hall/CRC
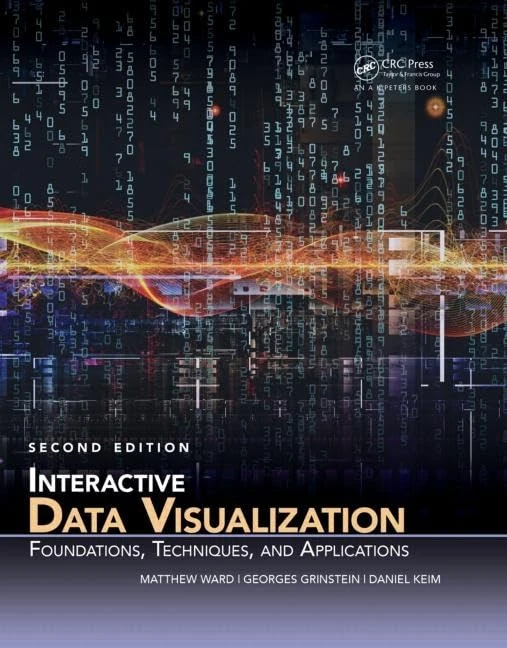
Interactive Data Visualization: Foundations, Techniques, and Applications, Second Edition (360 Degree Business)
CRC Press

Springer Advanced Data Analytics in Health - Smart Innovation 93
Springer
Analytics and Knowledge Management (Data Analytics Applications)
CRC Press
Victorians and Numbers: Statistics and Society in Nineteenth Century Britain
Oxford University Press
ICT Innovations 2014: World of Data: 311 (Advances in Intelligent Systems and Computing, 311)
Springer

Advances in Internet, Data & Web Technologies: The 10th International Conference on Emerging Internet, Data and Web Technologies (EIDWT-2022): 118 ... and Communications Technologies, 118)
Springer
Big Data and Social Science: Data Science Methods and Tools for Research and Practice (Chapman & Hall/CRC Statistics in the Social and Behavioral Sciences)
CRC Press

Big Data Analytics in Healthcare: 66 (Studies in Big Data, 66)
Springer

Information and Communication Technology for Intelligent Systems (ICTIS 2017) - Volume 1: 83 (Smart Innovation, Systems and Technologies, 83)
Springer
Big Data: Promise, Application and Pitfalls
Edward Elgar Publishing

Big Data and Smart Digital Environment: 53 (Studies in Big Data, 53)
Springer

Towards Digital Intelligence Society: A Knowledge-based Approach: 1281 (Advances in Intelligent Systems and Computing, 1281)
Springer

Advances in Internet, Data and Web Technologies: The 9th International Conference on Emerging Internet, Data & Web Technologies (EIDWT-2021): 65 ... and Communications Technologies, 65)
Springer
Graphing Data: Techniques for Display and Analysis: 36 (Applied Social Research Methods)
Sage Publications

Big Data and Smart Digital Environment: 53 (Studies in Big Data, 53)
Springer
Graphing Data: Techniques for Display and Analysis: 36 (Applied Social Research Methods)
Sage Publications
Communicating with Data: The Art of Writing for Data Science
Oxford University Press
Integrating Artificial Intelligence and Visualization for Visual Knowledge Discovery: 1014 (Studies in Computational Intelligence, 1014)
Springer

Data Science in Applications: 1084 (Studies in Computational Intelligence, 1084)
Springer

Advances in Data Science: Methodologies and Applications: 189 (Intelligent Systems Reference Library, 189)
Springer
Integrating Artificial Intelligence and Visualization for Visual Knowledge Discovery: 1014 (Studies in Computational Intelligence, 1014)
Springer

Intelligent Methods and Big Data in Industrial Applications: 40 (Studies in Big Data, 40)
Springer