We can't find the internet
Attempting to reconnect
Something went wrong
Hang in there while we get back on track
£116.68
This is the most expensive it has ever been. Walk away.
£117 today · previous high £117 · all-time low £115
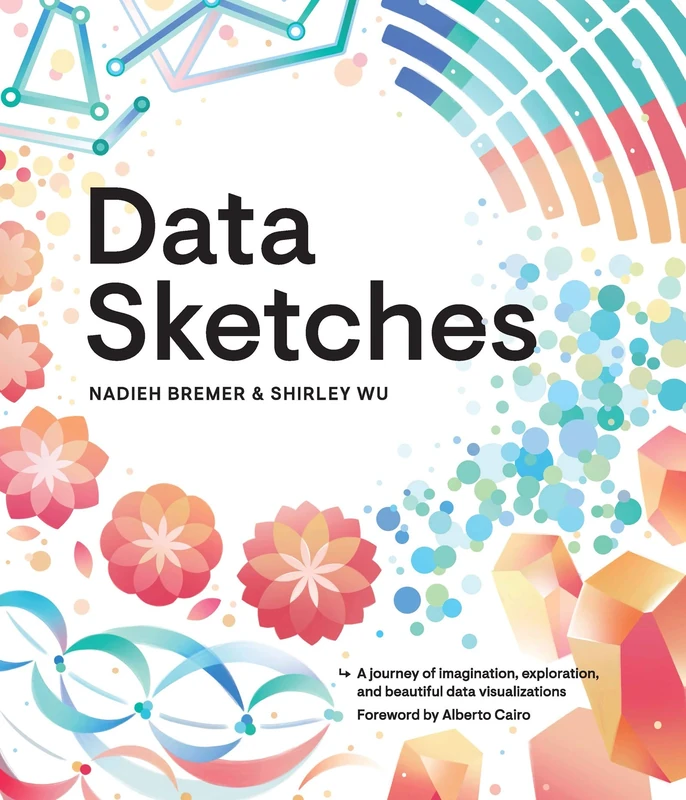
CRC Press Data Sketches - AK Peters Visualization Series Book
We'll watch every seller, every day. One email when your price arrives.
Price History & Forecast
Grey patches = out of stock. Cheaper = lower on the chart. Hover for exact prices.
Last 41 days · 41 data points (no recent data)
NEW HERE?
Amazon shows you one price. We show you all of them.
Tosheroon watches Amazon prices so you don't have to. Every product on Amazon has a price history — we make it visible. Set the price you'd actually pay, and we'll email you the second it gets there. No app, no account, one email.
WHAT'S ON THIS PAGE
when this has been cheap or pricey
where the price is heading next
all-time high & low, recent range
name your number, we'll email you
Price Distribution
Price distribution over 41 days • 2 price levels
Price Analysis
Most common price: £117 (40 days, 97.6%)
Price range: £115 - £117
Price levels: 2 different prices over 41 days
Description
Key Features
Documented by Nadieh Bremer and Shirley Wu, this book covers 24 unique data visualization projects.
The AK Peters Visualization Series provides technical insights into the mindset behind creative coding.
Explore 12 different themes such as the Olympics, Presidents & Royals, Movies, and Myths & Legends.
Learn how different technologies and forms can blur the line between data exploration and art.
This publication from CRC Press offers an intimate, behind-the-scenes account of the creative process.
Product Specifications
- Brand
- CRC Press
- Format
- hardcover
- ASIN
- 0367000121
- Category
- Books > Subjects > Computing & Internet > Databases > Data Storage & Management > Data Mining
- Domain
- Amazon UK
- Release Date
- 09 February 2021
- Listed Since
- 14 March 2020
Barcode
No barcode data available
Similar Products You Might Like
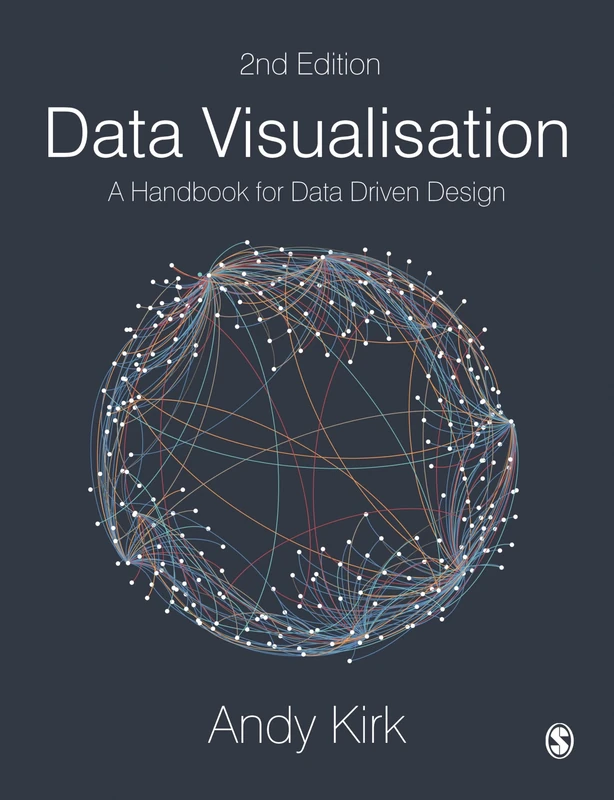
Sage Data Visualisation: A Handbook for Data Driven Design
Sage Publishing

Interactive Data Visualization: Foundations, Techniques, and Applications, Second Edition (360 Degree Business)
CRC Press
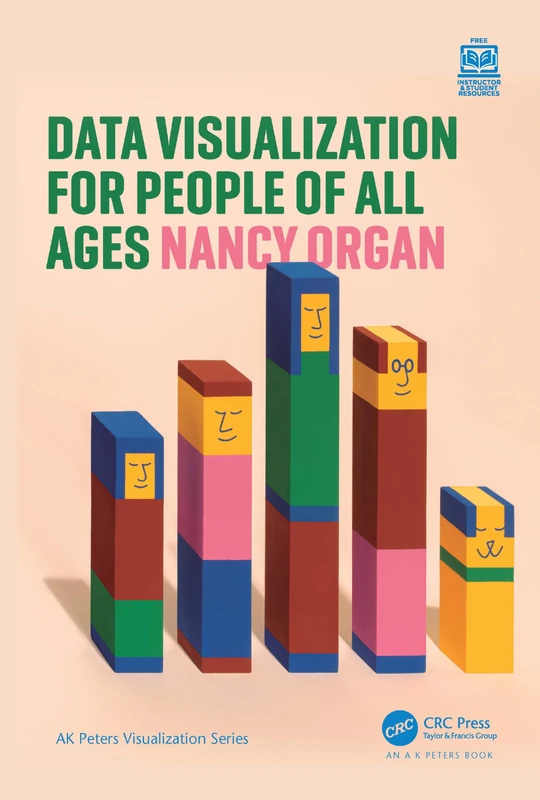
Data Visualization for People of All Ages (AK Peters Visualization Series)
Routledge
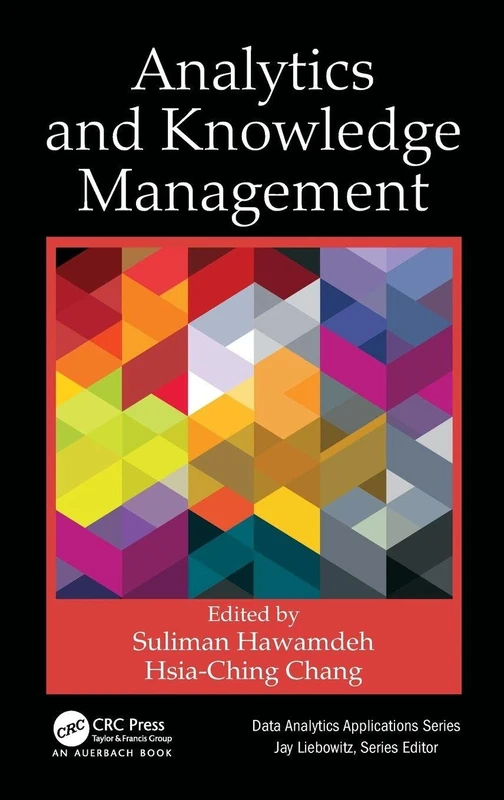
Analytics and Knowledge Management (Data Analytics Applications)
CRC Press
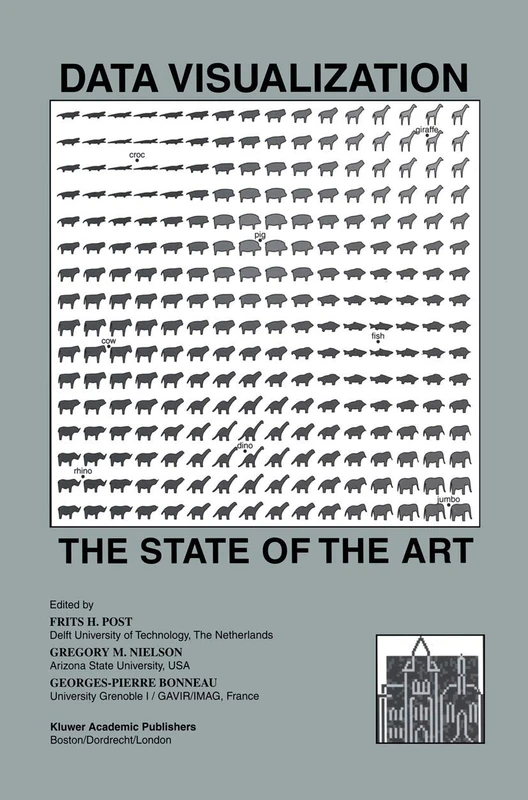
Data Visualization: The State of the Art - Springer 713
Springer
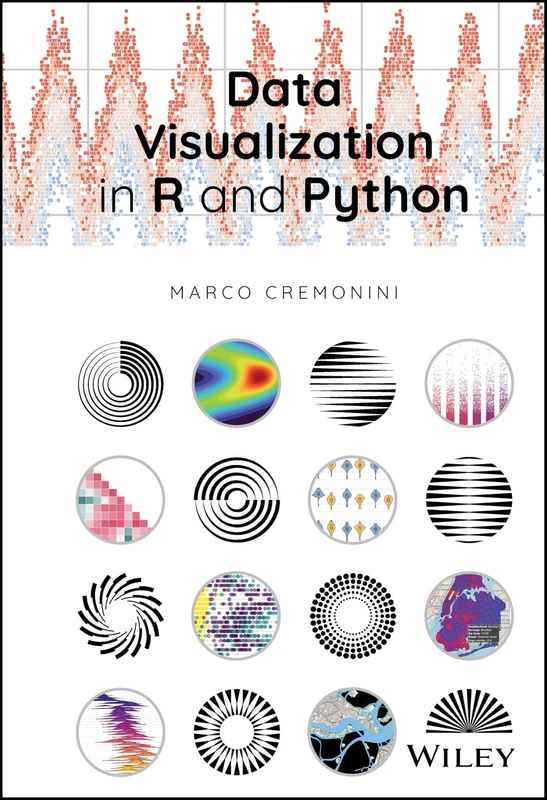
Data Visualization in R and Python
Wiley
Data Visualization Made Simple - Routledge Practical Guide
Routledge

Springer Advanced Data Analytics in Health - Smart Innovation 93
Springer
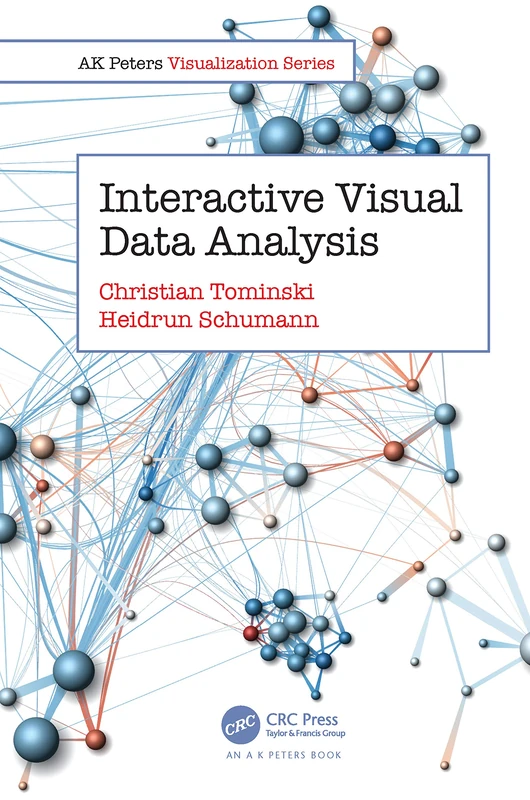
Interactive Visual Data Analysis (AK Peters Visualization Series)
CRC Press
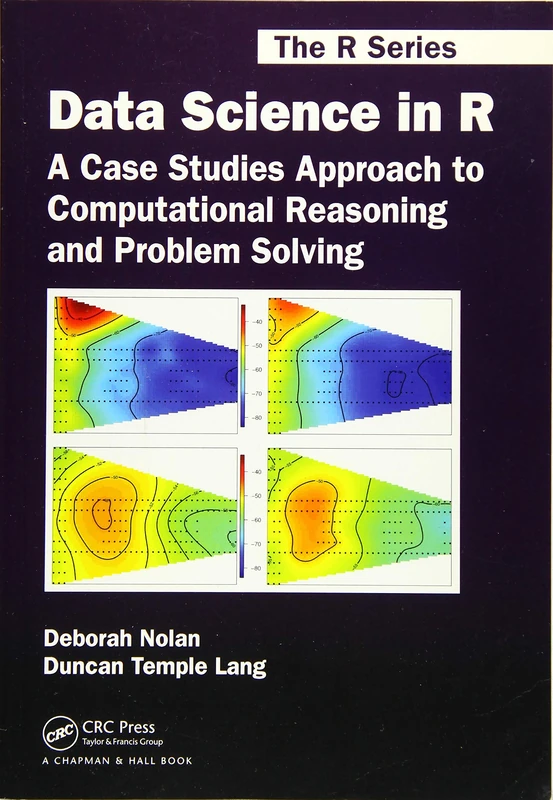
Data Science in R: A Case Studies Approach to Computational Reasoning and Problem Solving (Chapman & Hall/CRC: The R Series)
CRC Press
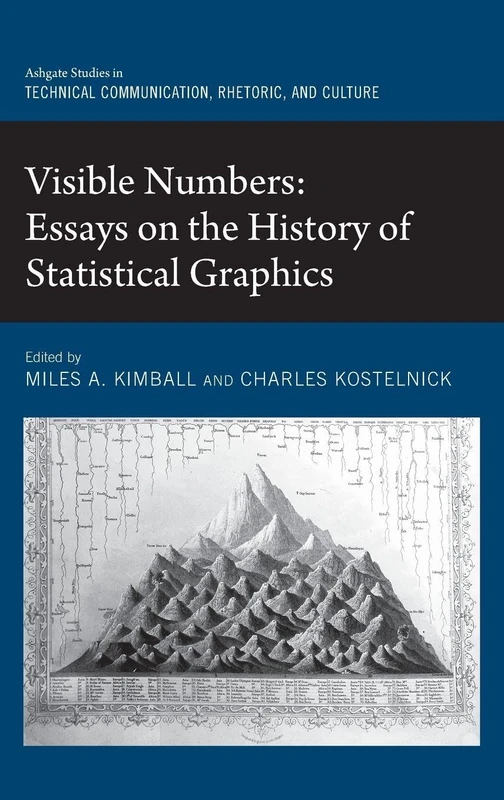
Visible Numbers: Essays on the History of Statistical Graphics (Routledge Studies in Technical Communication, Rhetoric, and Culture)
Routledge
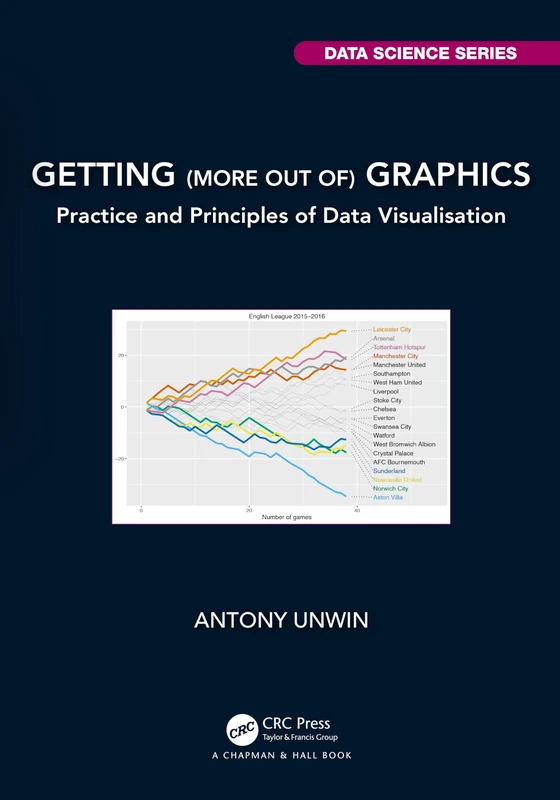
Getting (more out of) Graphics: Practice and Principles of Data Visualisation (Chapman & Hall/CRC Data Science Series)
Chapman and Hall/CRC
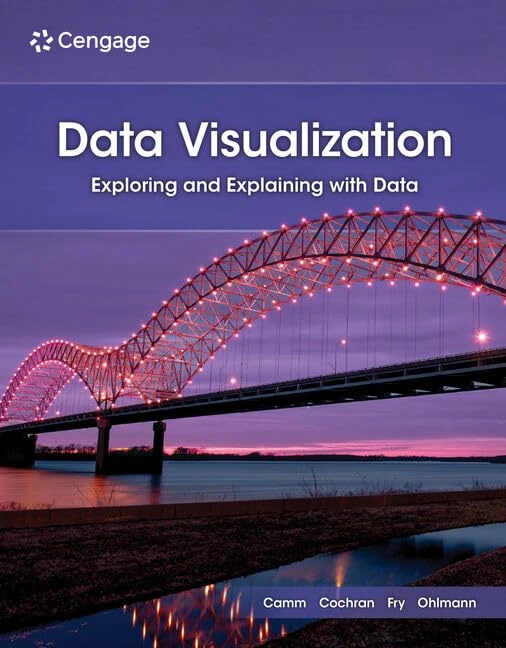
Data Visualization: Exploring and Explaining with Data
Cengage Learning
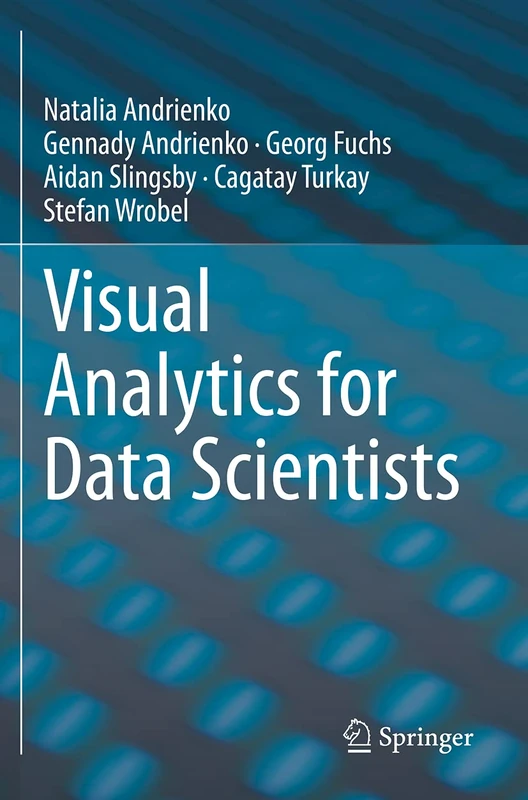
Visual Analytics for Data Scientists
Springer
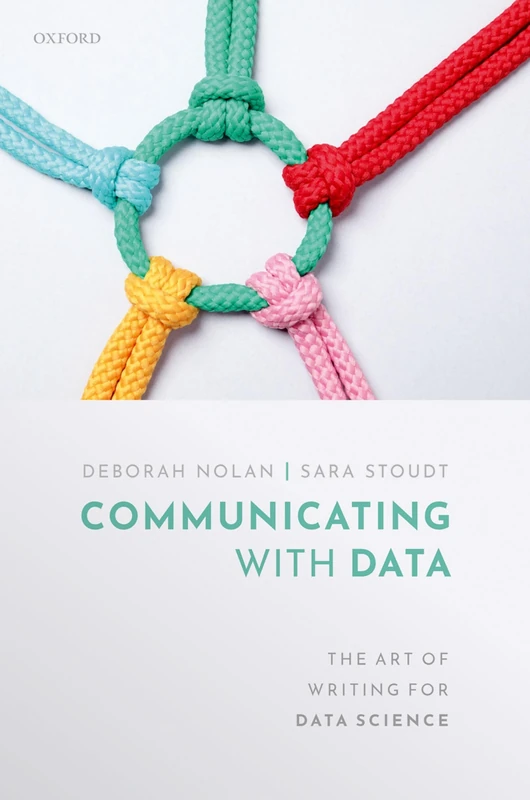
Communicating with Data: The Art of Writing for Data Science
Oxford University Press
Communicating with Data: The Art of Writing for Data Science
Oxford University Press
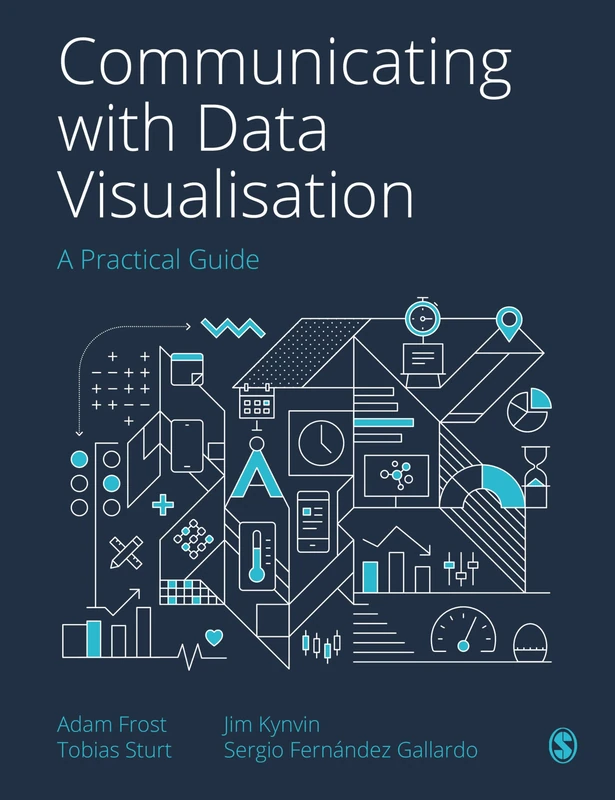
Communicating with Data Visualisation: A Practical Guide
Sage Publishing
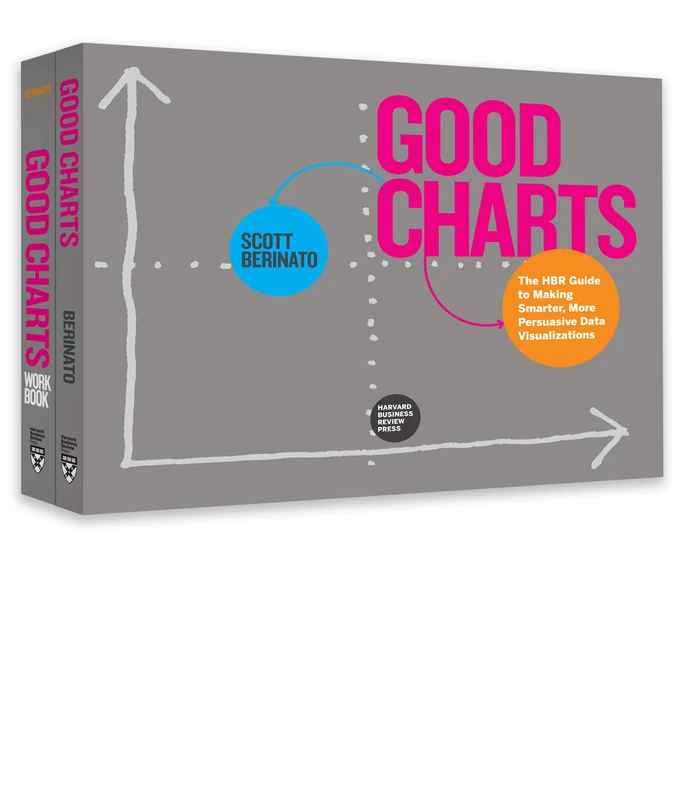
The Harvard Business Review Good Charts Collection: Tips, Tools, and Exercises for Creating Powerful Data Visualizations
Harvard Business Review Press
Graphing Data: Techniques for Display and Analysis: 36 (Applied Social Research Methods)
Sage Publishing
Graphing Data: Techniques for Display and Analysis: 36 (Applied Social Research Methods)
Sage Publishing

Integrating Artificial Intelligence and Visualization for Visual Knowledge Discovery: 1014 (Studies in Computational Intelligence, 1014)
Springer