We can't find the internet
Attempting to reconnect
Something went wrong
Hang in there while we get back on track
£104.67
It has never been this cheap. We have no record of a lower price.
£105 today · cheaper than every other day in the last 3 months
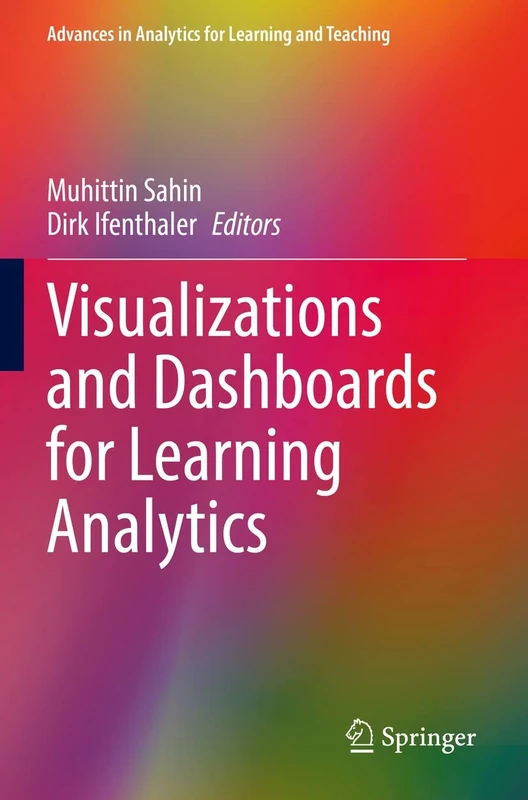
Springer Visualizations and Dashboards for Learning Analytics
We'll watch every seller, every day. One email when your price arrives.
Price History & Forecast
Grey patches = out of stock. Cheaper = lower on the chart. Hover for exact prices.
Last 33 days · 33 data points (no recent data)
NEW HERE?
Amazon shows you one price. We show you all of them.
Tosheroon watches Amazon prices so you don't have to. Every product on Amazon has a price history — we make it visible. Set the price you'd actually pay, and we'll email you the second it gets there. No app, no account, one email.
WHAT'S ON THIS PAGE
when this has been cheap or pricey
where the price is heading next
all-time high & low, recent range
name your number, we'll email you
Price Distribution
Price distribution over 33 days • 1 price levels
Price Analysis
Most common price: £105 (33 days, 100.0%)
Price range: £105 - £105
Price levels: 1 different prices over 33 days
Description
Key Features
This Springer volume provides a guide to efficient implementation of visualization and dashboard design for learning analytics.
The text covers stakeholder preferences and learner patterns on the dashboard to improve design effectiveness.
Readers can learn about the usability of visualization techniques and how to design effective dashboards and interventions.
The book includes information on learning and instructional design specifically for learning analytics applications.
It addresses important privacy and security issues regarding dashboard data to help stakeholders manage information safely.
Product Specifications
- Brand
- Springer
- Format
- paperback
- ASIN
- 3030812243
- Domain
- Amazon UK
- Release Date
- 18 December 2022
- Listed Since
- 20 November 2022
Barcode
No barcode data available
Similar Products You Might Like

SAP Press - Designing Dashboards with SAP Analytics Cloud
SAP Press

Apress Dashboards for Excel - Data Visualization Guide
Apress

Advancing the Power of Learning Analytics and Big Data in Education (Advances in Educational Technologies and Instructional Design)
Information Science Reference

Advancing the Power of Learning Analytics and Big Data in Education (Advances in Educational Technologies and Instructional Design)
Information Science Reference

Learning Analytics in Higher Education: Current Innovations, Future Potential, and Practical Applications
Routledge

Learning Analytics: Fundamentals, Applications & Trends - Springer
Springer

Learning Analytics in Higher Education: Current Innovations, Future Potential, and Practical Applications
Routledge

Applying Data Science and Learning Analytics Throughout a Learner's Lifespan (e-Book Collection - Copyright 2022)
Information Science Reference

Data Visualization in R and Python
Wiley
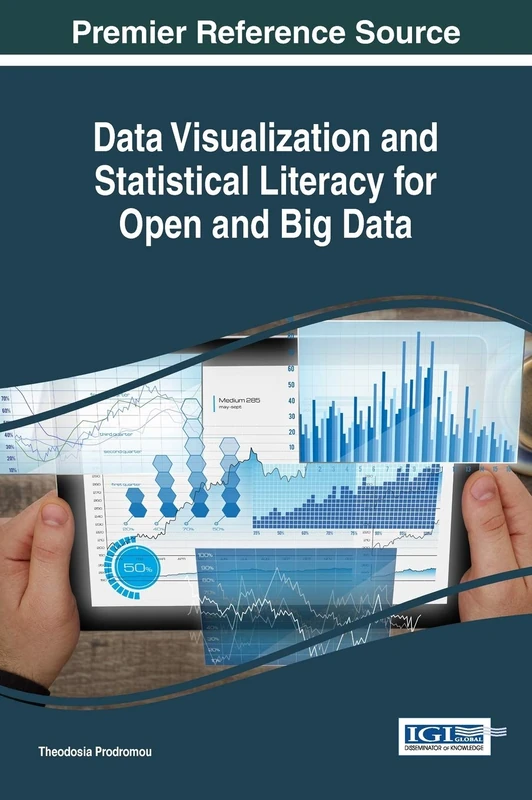
Data Visualization and Statistical Literacy for Open and Big Data (Advances in Data Mining and Database Management)
Information Science Reference
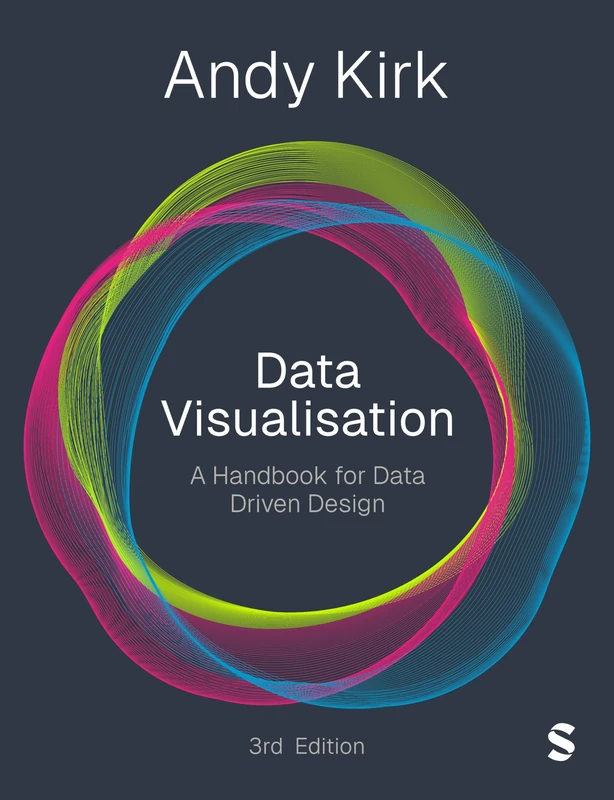
Data Visualisation: A Handbook for Data Driven Design
Sage Publishing

A Beginner’s Guide to Learning Analytics (Advances in Analytics for Learning and Teaching)
Springer

Analytics and Knowledge Management (Data Analytics Applications)
CRC Press

Learning Analytics Goes to School: A Collaborative Approach to Improving Education
Routledge

Learning Analytics: Fundaments, Applications, and Trends: A View of the Current State of the Art to Enhance e-Learning: 94 (Studies in Systems, Decision and Control, 94)
Springer

Visual Analytics for Management: Translational Science and Applications in Practice
Routledge

Data Visualization: Exploring and Explaining with Data
Cengage Learning
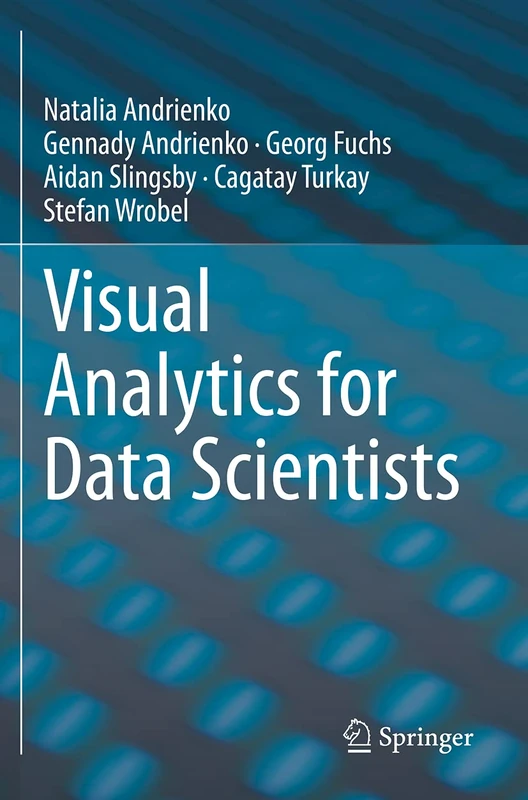
Visual Analytics for Data Scientists
Springer
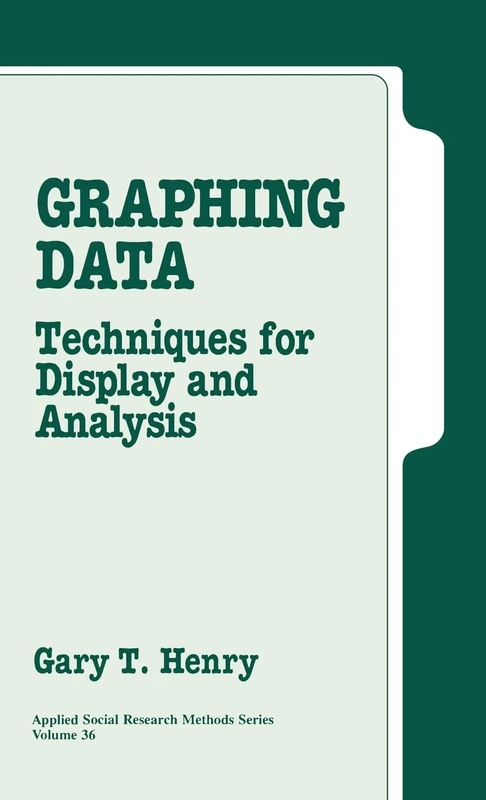
Graphing Data: Techniques for Display and Analysis: 36 (Applied Social Research Methods)
Sage Publishing

Interactive Visual Data Analysis (AK Peters Visualization Series)
CRC Press

Data Visualization Made Simple - Routledge Practical Guide
Routledge

Data Storytelling and Visualization with Tableau: A Hands-on Approach
CRC Press
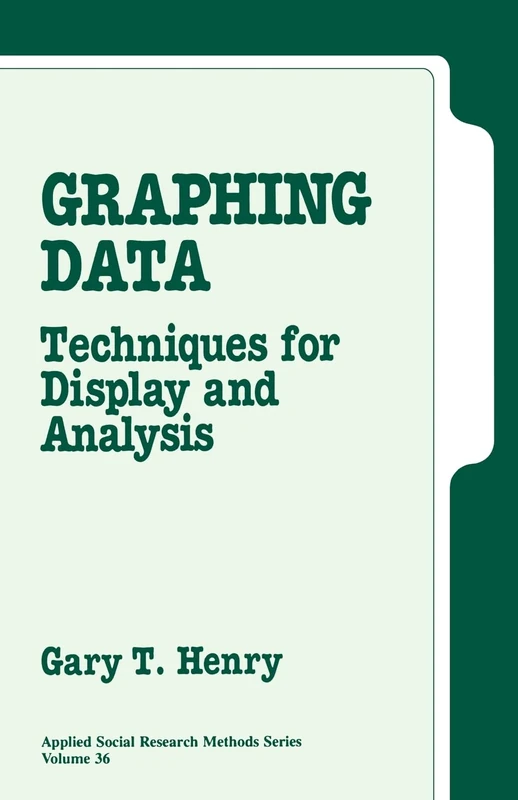
Graphing Data: Techniques for Display and Analysis: 36 (Applied Social Research Methods)
Sage Publishing

Artificial Intelligence and Visualization: Advancing Visual Knowledge Discovery: Current Status and Analysis: 1126 (Studies in Computational Intelligence, 1126)
Springer