We can't find the internet
Attempting to reconnect
Something went wrong
Hang in there while we get back on track
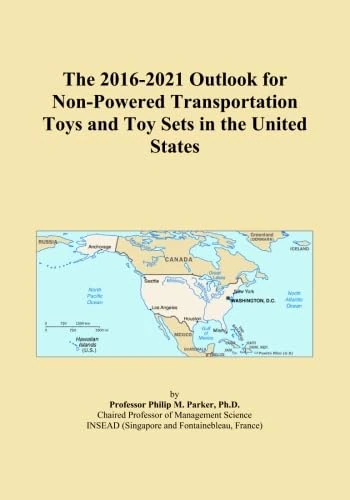
£595.00
It has never been this cheap. We have no record of a lower price.
£595 today · cheaper than every other day in the last 3 months
Non-Powered Transportation Toys Outlook 2016-2021 Study
We'll watch every seller, every day. One email when your price arrives.
Price History & Forecast
Grey patches = out of stock. Cheaper = lower on the chart. Hover for exact prices.
Last 31 days · 31 data points (no recent data)
NEW HERE?
Amazon shows you one price. We show you all of them.
Tosheroon watches Amazon prices so you don't have to. Every product on Amazon has a price history — we make it visible. Set the price you'd actually pay, and we'll email you the second it gets there. No app, no account, one email.
WHAT'S ON THIS PAGE
when this has been cheap or pricey
where the price is heading next
all-time high & low, recent range
name your number, we'll email you
Price Distribution
Price distribution over 31 days • 1 price levels
Price Analysis
Most common price: £595 (31 days, 100.0%)
Price range: £595 - £595
Price levels: 1 different prices over 31 days
Description
Key Features
Provides latent demand outlooks for non-powered transportation toys and toy sets from 2016 to 2021.
Includes potential industry earnings (P.I.E.) estimates in millions of U.S. dollars for approximately 12,700 cities.
Offers comparative benchmarks by reporting the percent share of each city relative to its state and the United States.
Supports distribution and sales force strategies through detailed econometric and statistical data.
Covers market demand across various states and cities throughout the United States.
Product Specifications
- Format
- paperback
- ASIN
- B01ETRORB2
- Domain
- Amazon UK
- Release Date
- 30 September 2015
- Listed Since
- 26 April 2016
Similar Products You Might Like
Japan Non-Powered Transportation Toys Econometric Study
The 2016-2021 Outlook for Non-Powered Transportation Toys and Toy Sets in Greater China
The 2016-2021 Outlook for Parts for Non-Electronic Toys in Japan
US Plastics Non-Powered Transportation Toy Market Outlook

Japan Remote-Controlled Toy Market Outlook 2016-2021 Study
Plastics Non-Powered Transportation Toys Outlook - Greater China

Scientific Toys Japan Market Outlook 2016-2021 Report

The 2016-2021 Outlook for Ride-On Toys in Japan

India Toy Stores Market Outlook 2023-2028 Study Report

Smart Toys in India 2023-2028 Outlook - Market Study

US Juvenile Sporting and Water Toy Market Outlook 2016-2021