We can't find the internet
Attempting to reconnect
Something went wrong
Hang in there while we get back on track
£43.79
24 prices in 30 days. Set your target and stop checking.
£44 today · 24 changes in last 30 days · range £41–£45
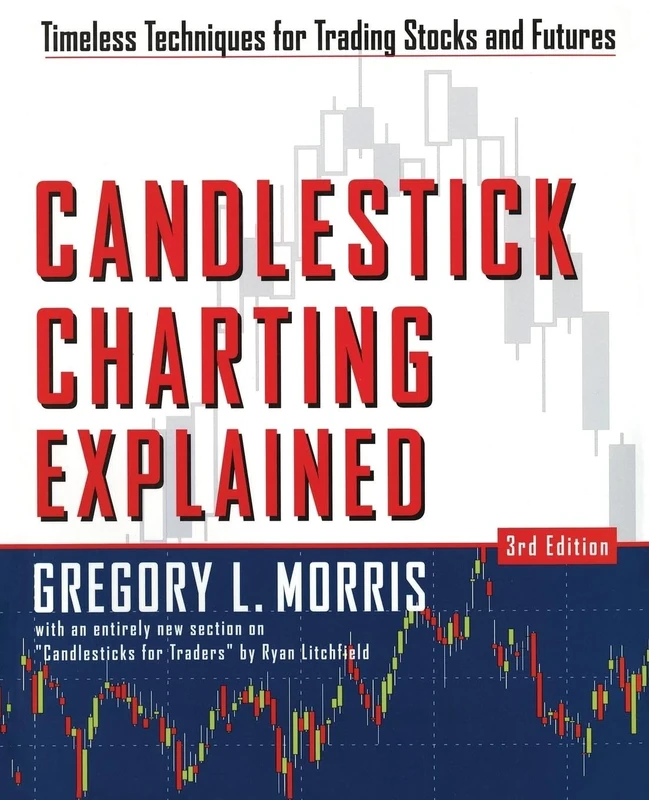
McGraw-Hill Education Candlestick Charting Explained - McGraw-Hill Trading Guide
We'll watch every seller, every day. One email when your price arrives.
Price History & Forecast
Grey patches = out of stock. Cheaper = lower on the chart. Hover for exact prices.
Last 91 days · 91 data points
NEW HERE?
Amazon shows you one price. We show you all of them.
Tosheroon watches Amazon prices so you don't have to. Every product on Amazon has a price history — we make it visible. Set the price you'd actually pay, and we'll email you the second it gets there. No app, no account, one email.
WHAT'S ON THIS PAGE
when this has been cheap or pricey
where the price is heading next
all-time high & low, recent range
name your number, we'll email you
Price Distribution
Price distribution over 91 days • 5 price ranges
Price Analysis
Most common range: £40-41 (32 days, 35.2%)
Price range: £38 - £46
Price levels: 5 price ranges over 91 days
Description
Key Features
Candlestick charting fundamentals and techniques for identifying profitable stock and futures trades.
Integration of Western charting analysis with Japanese candlestick methods for comprehensive market analysis.
Grouping candlesticks into families to recognise patterns and trading opportunities more effectively.
Strategies for detecting and avoiding false signals in candlestick charting to reduce trading losses.
Updated charts and contemporary analysis from McGraw-Hill Education's professional finance expertise.
Product Specifications
- Brand
- McGraw-Hill Education
- Format
- paperback
- ASIN
- 007146154X
- Domain
- Amazon UK
- Release Date
- 27 March 2006
- Listed Since
- 06 February 2007
Barcode
No barcode data available
Similar Products You Might Like
Trading Applications of Japanese Candlestick Charting: 38 (Wiley Finance)
Wiley

Penguin Japanese Candlestick Charting Techniques - 2nd Edition
Penguin
Price Action & Candlestick Charting Practice Guide: Improve Understanding Of Market Context & Improve Charting Skills Through Examples & Practice
Mastering Financial Pattern Recognition: Finding and Back-Testing Candlestick Patterns with Python
O'Reilly

The Power of Japanese Candlestick Charts: Advanced Filtering Techniques for Trading Stocks, Futures, and Forex (Wiley Trading)
Wiley
Beyond Candlesticks: New Japanese Charting Techniques Revealed: 56 (Wiley Finance)
Wiley
Les Chandeliers japonais : Un guide contemporain sur d'anciennes techniques d'investissement venues d'extrême-orient
VALOR
Applied Technical Analysis for Advanced Learners and Practitioners: In Charts We Trust
Emerald Group Publishing Limited

Maximisez vos profits avec les chandeliers: Comment déceler les meilleures opportunités pour optimiser vos gains
VALOR