We can't find the internet
Attempting to reconnect
Something went wrong
Hang in there while we get back on track
£446.25
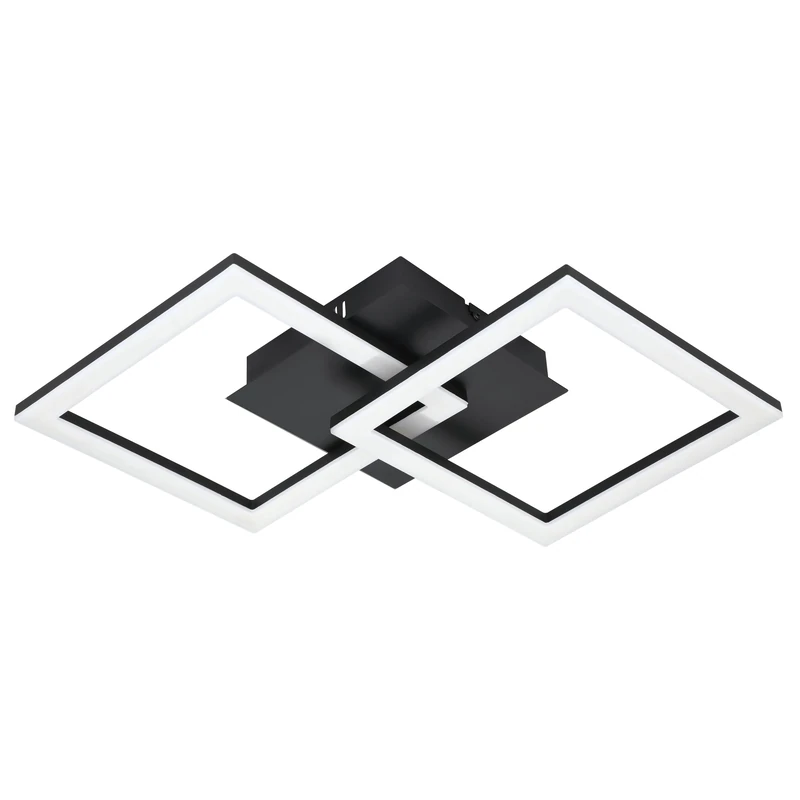
The 2019-2024 Outlook for Ceiling Light Fixtures in the United States
Price data last checked 40 day(s) ago - refreshing...
We'll watch every seller, every day. One email when your price arrives.
It has never been this cheap. We have no record of a lower price.
£446 today · cheaper than every other day in the last 3 months
NEW HERE?
Amazon shows you one price. We show you all of them.
Tosheroon watches Amazon prices so you don't have to. Every product on Amazon has a price history — we make it visible. Set the price you'd actually pay, and we'll email you the second it gets there. No app, no account, one email.
WHAT'S ON THIS PAGE
when this has been cheap or pricey
where the price is heading next
all-time high & low, recent range
name your number, we'll email you
Price History & Forecast
Grey patches = out of stock. Cheaper = lower on the chart. Hover for exact prices.
Last 51 days · 51 data points (no recent data)
Price Distribution
Price distribution over 51 days • 1 price levels
Price Analysis
Most common price: £446 (51 days, 100.0%)
Price range: £446 - £446
Price levels: 1 different prices over 51 days
Description
Product Specifications
- Format
- paperback
- ASIN
- B07F5DZD1N
- Domain
- Amazon UK
- Release Date
- 20 June 2018
- Listed Since
- 01 July 2018
Similar Products You Might Like
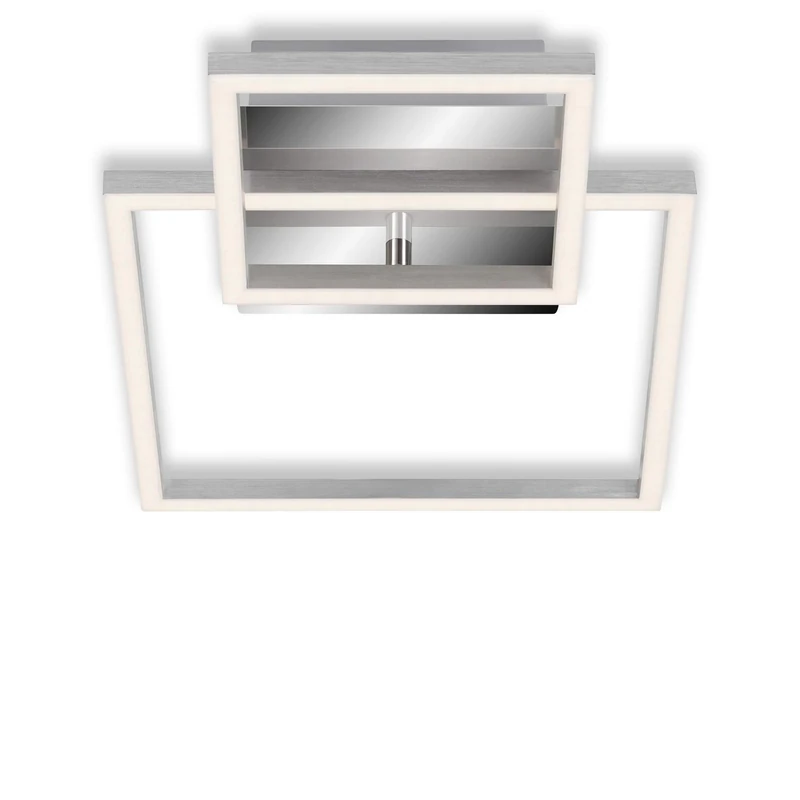
BRILONER Leuchten - Ceiling Light, dimmable Ceiling Light, incl. Memory Function, 1 Rotating LED Bulb, 19.6 watts, 1500 lumens, 3000 Kelvin, Bright Aluminium, 358 x 260 x 75 mm (L x B x H)
Briloner
Price unavailable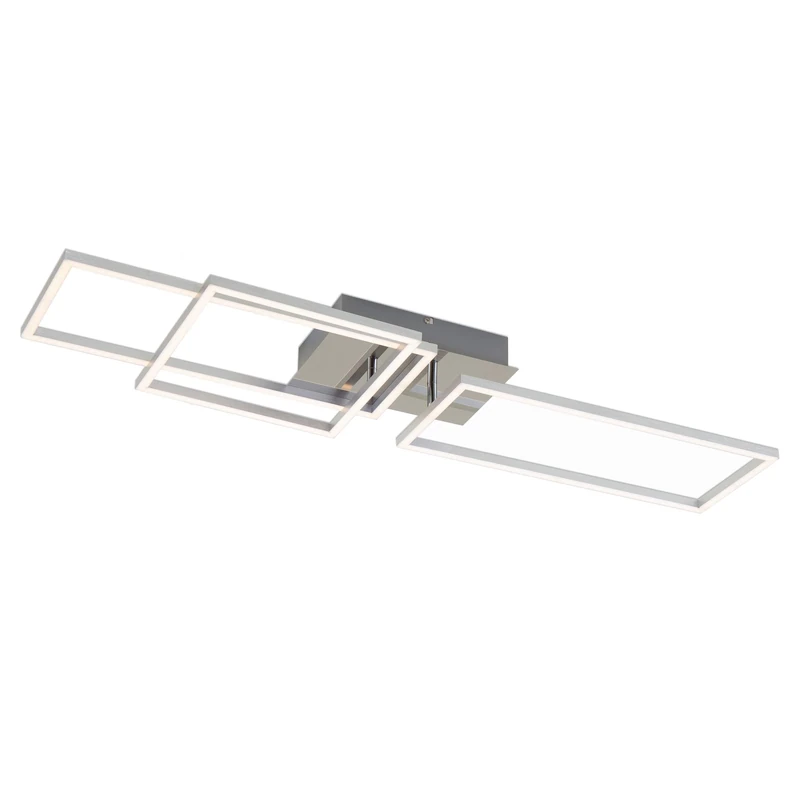
BRILONER Leuchten - LED Ceiling Light, dimmable Ceiling lamp, incl. Memory Function, 2 Rotating LED modules, 43.8 watts, 3,300 lumens, 3,000 Kelvin, Chrome-Aluminium, 928x260x96mm (LxWxH) 3136-018
Briloner
Price unavailable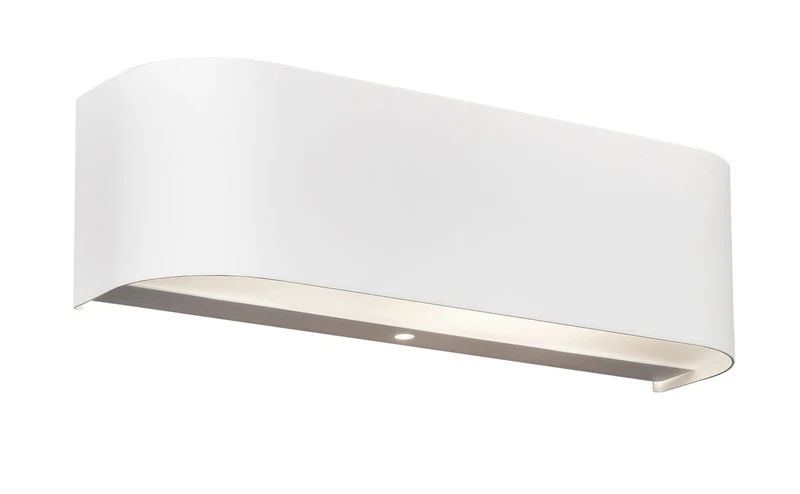
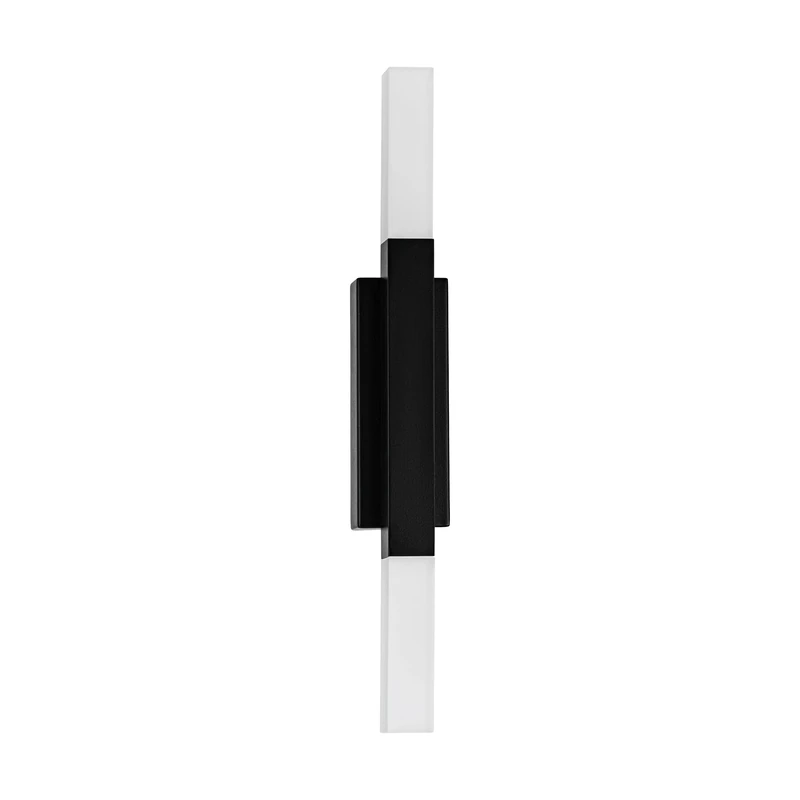
Trio Leuchten 627410406 LED Wall Light, White Frosted Glass
Trio Leuchten
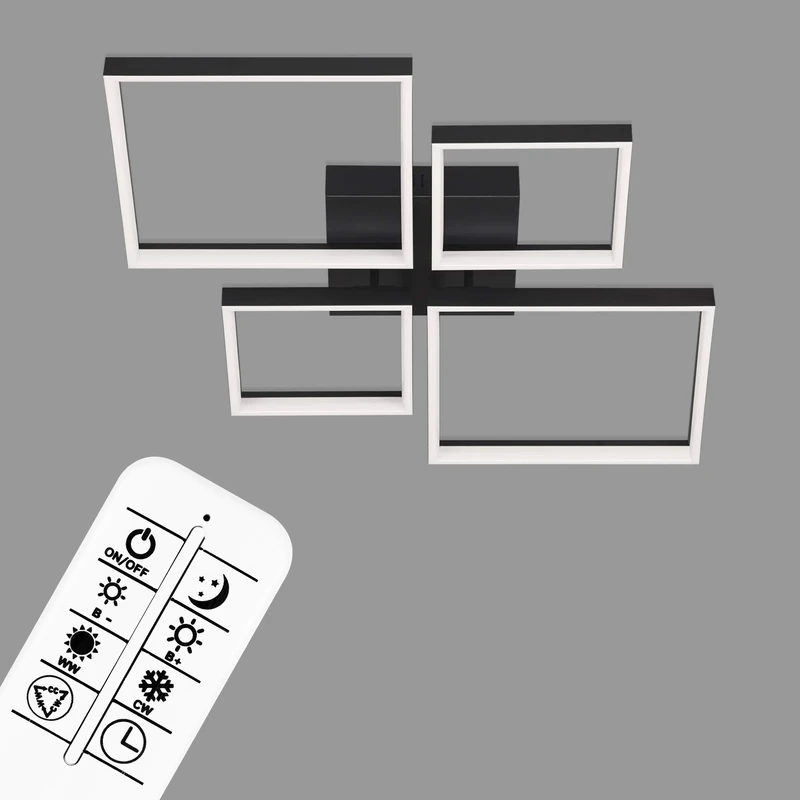
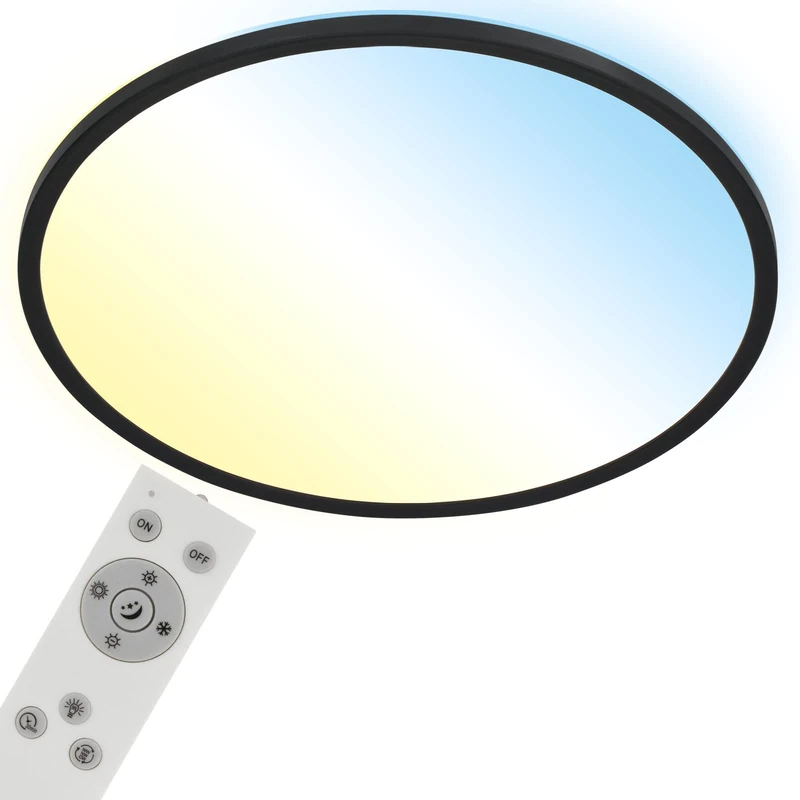
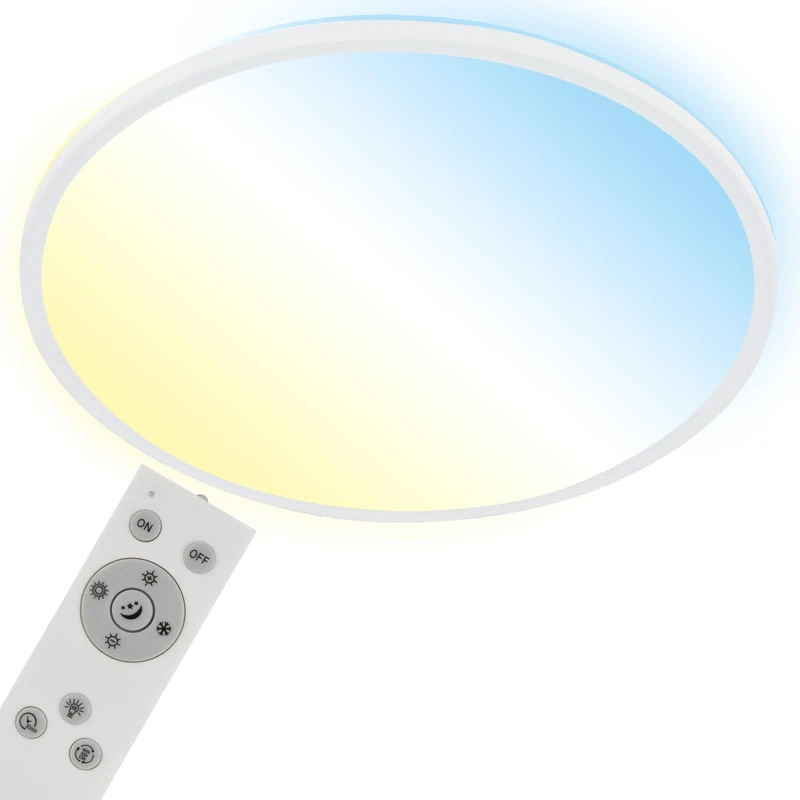
BRILONER Leuchten LED, dimmable Ceiling lamp, incl. Remote, Colour Temperature Control, Night Light Function and Timer, Black, 40 watts, 4,400 lumens, 660 x 660 x 90mm (LxWxH), 3015-015
Briloner
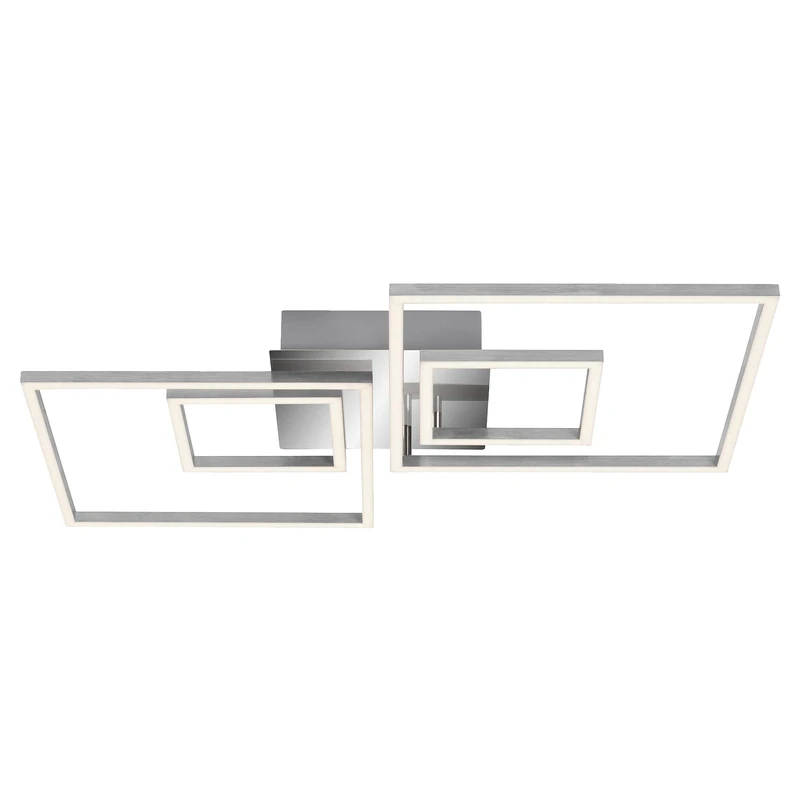
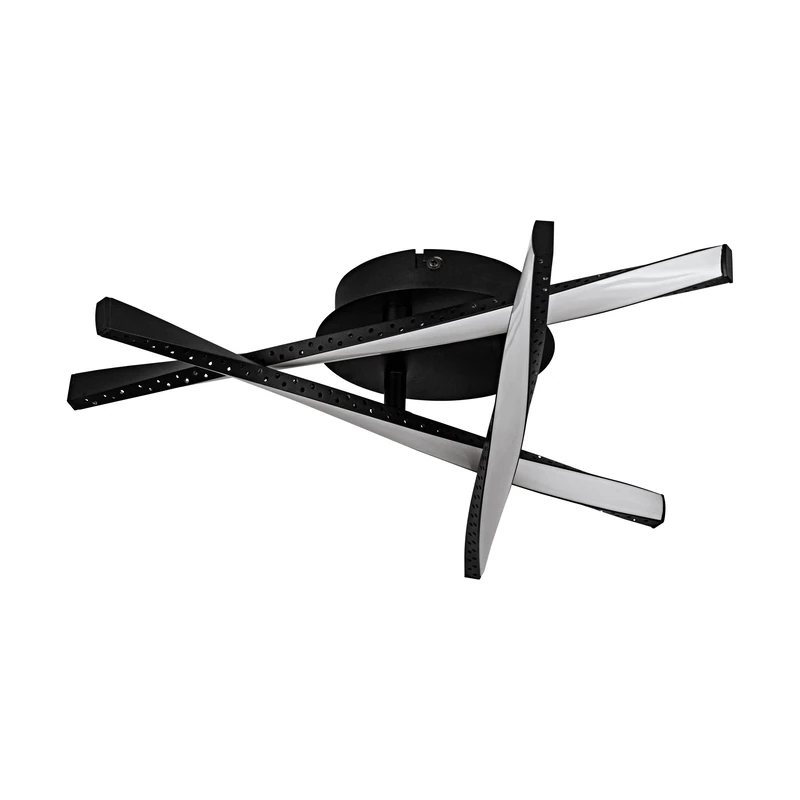
BRILONER Leuchten - LED Ceiling Light, dimmable Ceiling lamp, incl. Memory Function, 2 Rotating LED modules, 43.8 watts, 3,600 lumens, 3,000 Kelvin, Chrome-Aluminium, 656x520x96mm (LxWxH)
Briloner
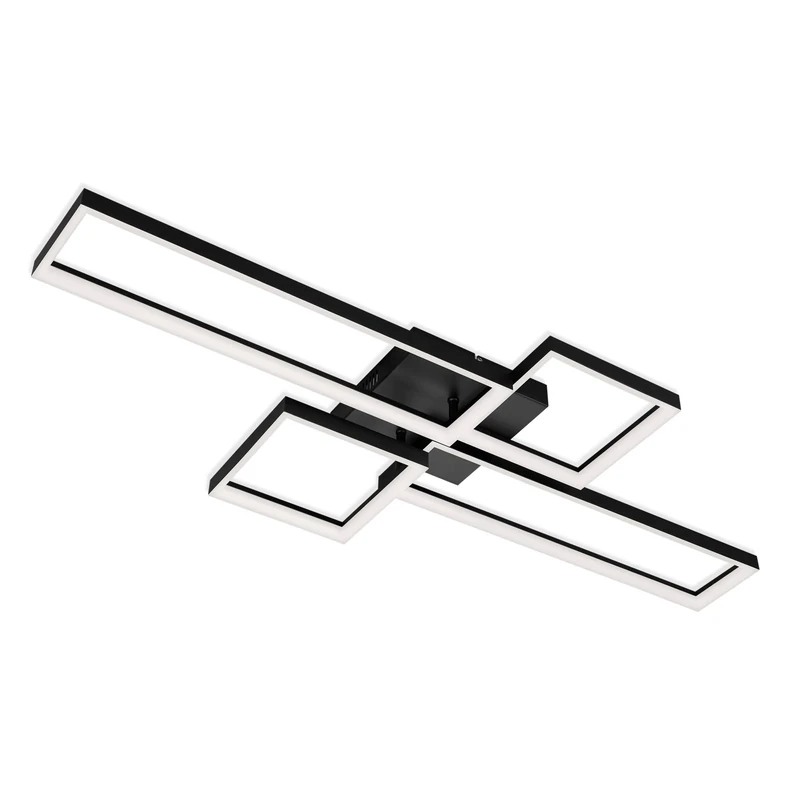
BRILONER - LED Ceiling Light with Remote Control, dimmable, CCT Warm to Cold White, Ceiling Lights Living Room, Bedroom, Lounge, 49 x 6.5 cm, Anthracite
Briloner
Price unavailable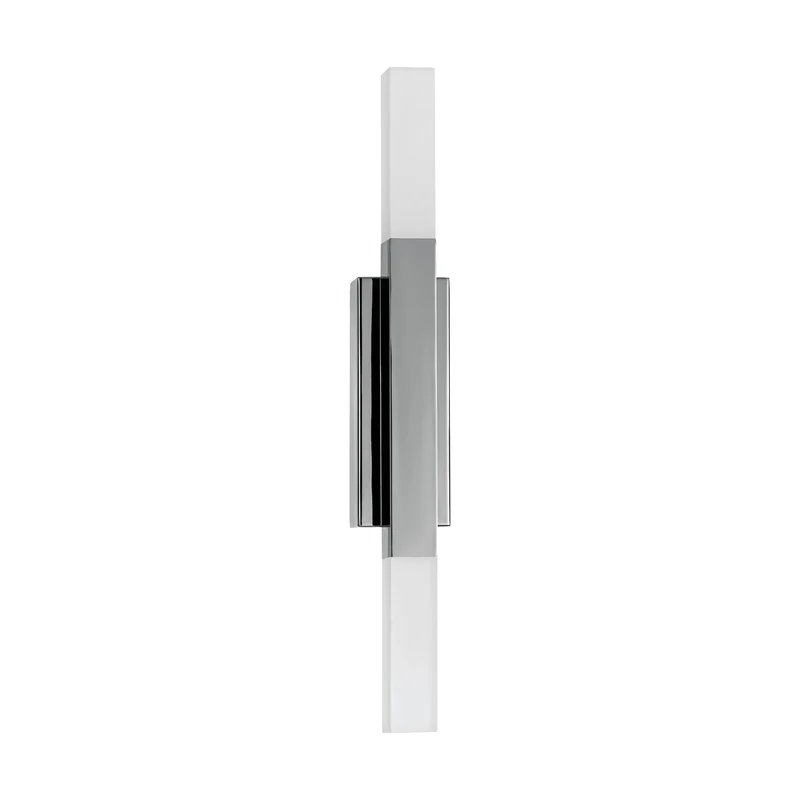
Eglo LED wall lamp Alcudia, up and Down Light, Hallway and Bathroom Lighting Fixture Made of Chrome-Coloured Metal and Satin-Finished Plastic, Warm White, IP44
Eglo
Eglo LED wall lamp Alcudia, up and Down Light, Hallway and Bathroom Lighting Fixture Made of Black Metal and Satin-Finished Plastic, Warm White, IP44
Eglo
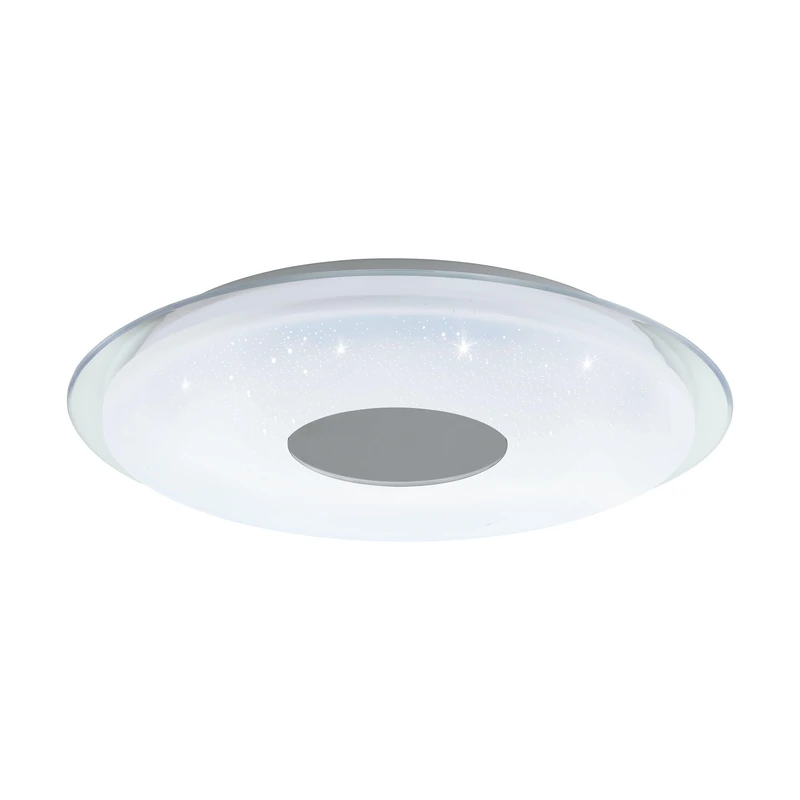
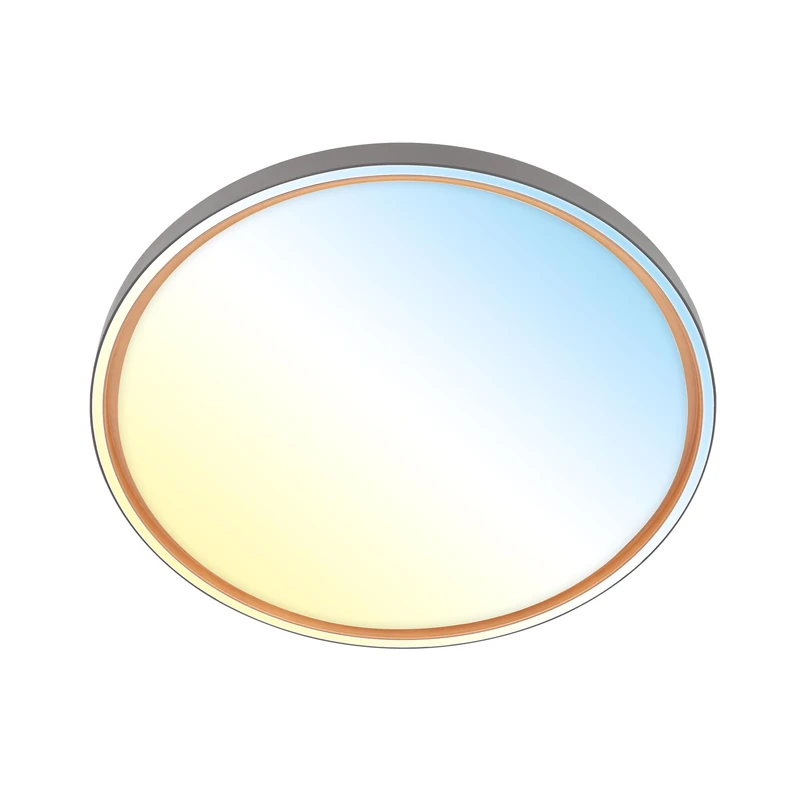
EGLO Connect Lanciano-C LED Ceiling Light, 1 Bulb Wall Light with Crystal Effect, Steel, Plastic, White, Transparent, Chrome, Remote Control, Colour Temperature Changing (Warm - Cold), RGB, Dimmable, Diameter 56 cm
Eglo
BRILONER Leuchten LED Ceiling Light CCT, LED Ceiling Light Backlight, Ultra Flat, Dimmable, Remote Control, Warm White, Neutral White, Cool White, 480 x 30 mm
Briloner
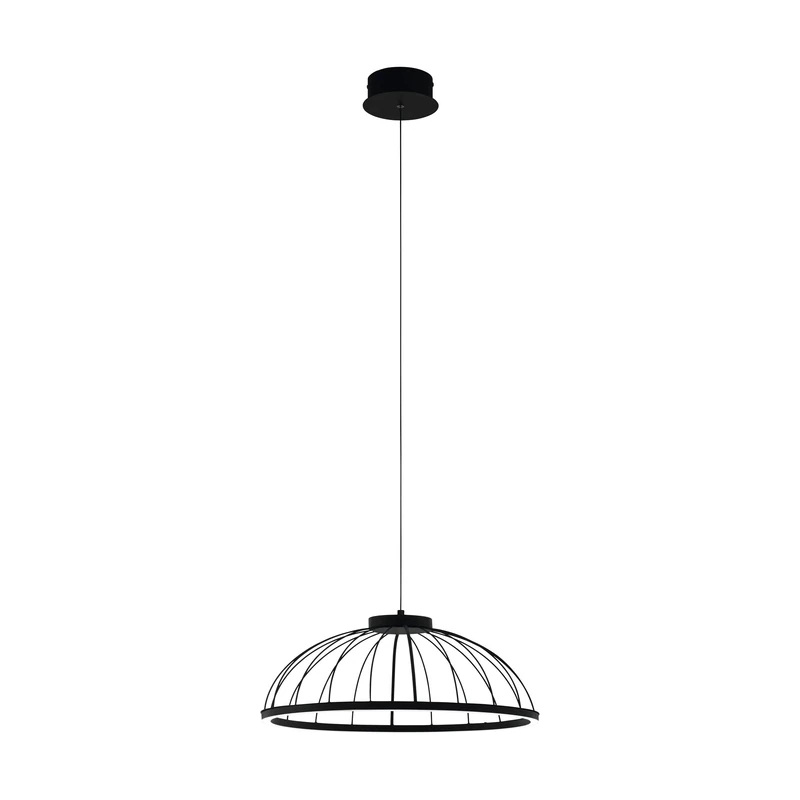
EGLO Bogotenillo LED Pendant Light, 1 Bulb Vintage, Modern, Pendant Light Made of Steel and Plastic, Dining Table Lamp in Black, White, Hanging Living Room Lamp, Diameter 50 cm
Eglo
Segula 2.7 W Matt LED Light Bulb
SEGULA
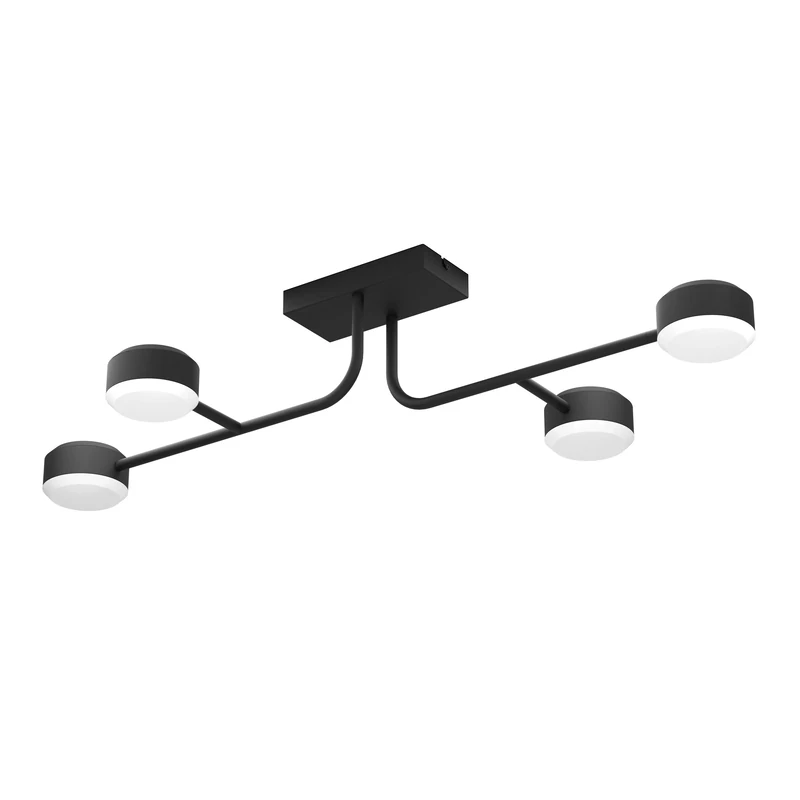
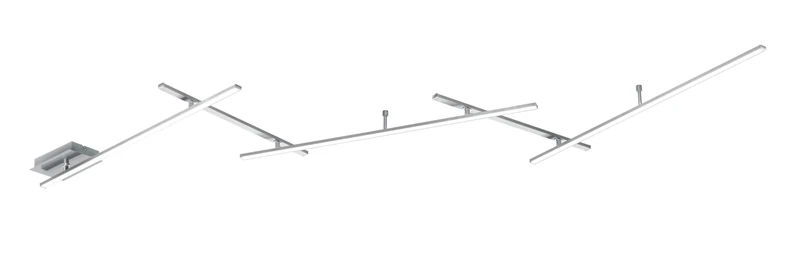
Eglo LED Spotlight bar Clavellina, dimmable Ceiling Light Fitting with 4 Spots, Minimalist Living Room lamp Made of Black Steel and White Plastic, Warm White
Eglo
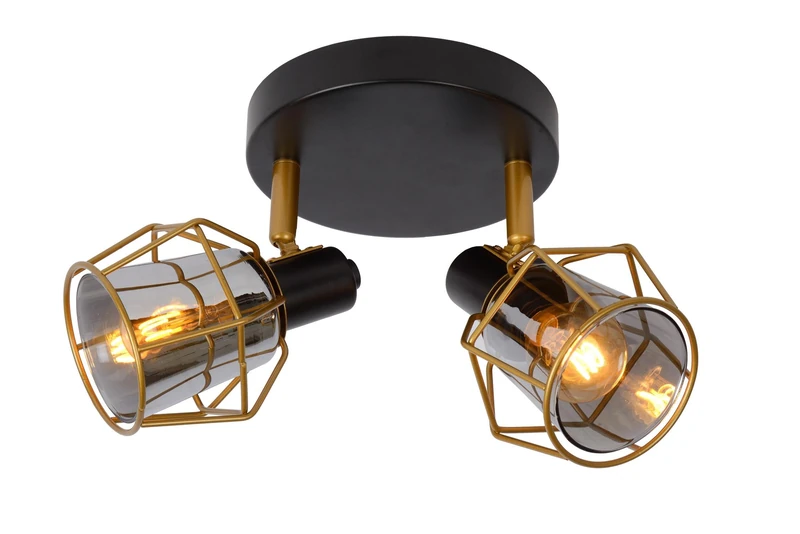
LUCIDE NILA - Ceiling Spotlight - 2xE14 - Black
LUCIDE
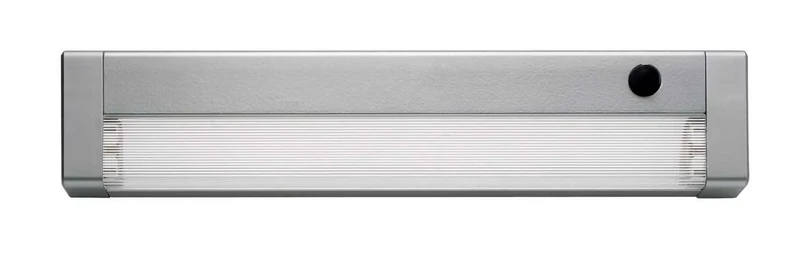
Sylvania LS100 – LUMINAIRE LS100 35 W T5 830
Sylvania
Eglo LED Ceiling lamp Adeje, Minimalist Light Fitting, Living Room, Bedroom and Hallway Lighting, Black Metal and White Plastic, Warm White, 16 x 44 cm
Eglo
BRILONER Leuchten 3728-016 LED Ceiling Light CCT, Ceiling Light, Ultra Flat, Dimmable, Remote Control, Warm White, Neutral White, Cool White, 480 x 30 mm
Briloner
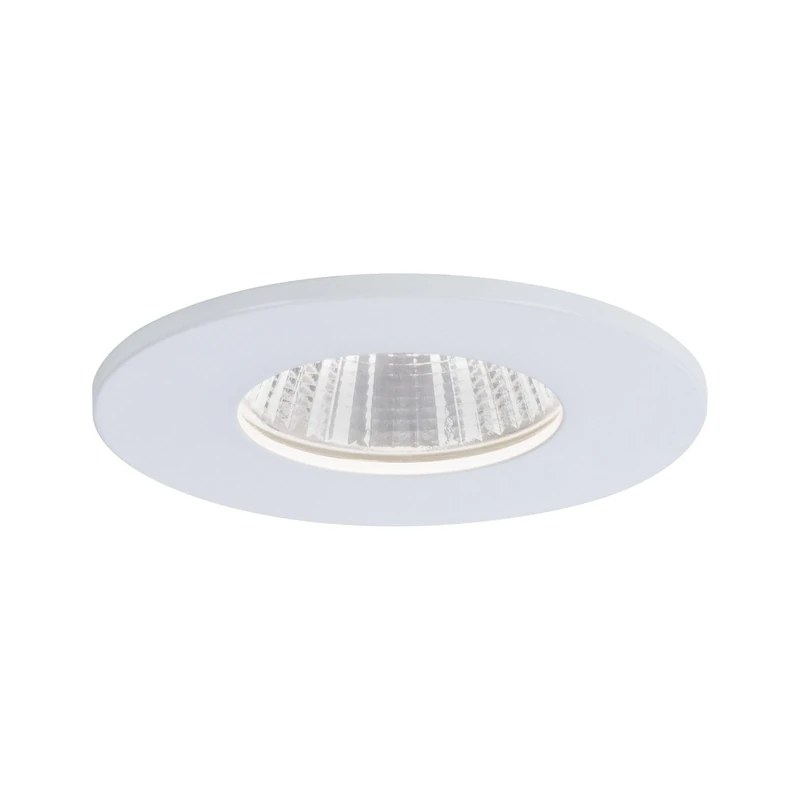
Paulmann 93670 Calla LED recessed luminaire Round incl. 1x7W recessed Spotlight IP65 White matt spot Plastic, Aluminium recessed lamp 4000K
Paulmann
Briloner Leuchten - LED ceiling light, dimmable ceiling lamp, incl. remote control, colour temperature control, night light and timer, black, 40 watts, 4,400 lumens, 1100 x 420 x 120 mm (L x W x H) 3014-015
Briloner
Trio Leuchten Indira 674610507 LED Ceiling Light Metal Matte Nickel Acrylic White 3 x 6 Watt and 2 x 3.5 Watt
Trio Leuchten
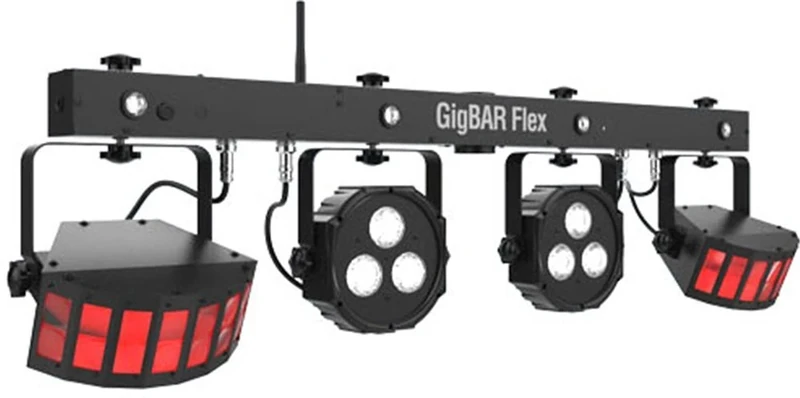
Chauvet GIGBAR Flex 3 in 1 DJ Effect Lighting System Derby Par Strobe Disco
CHAUVET DJ
Price unavailable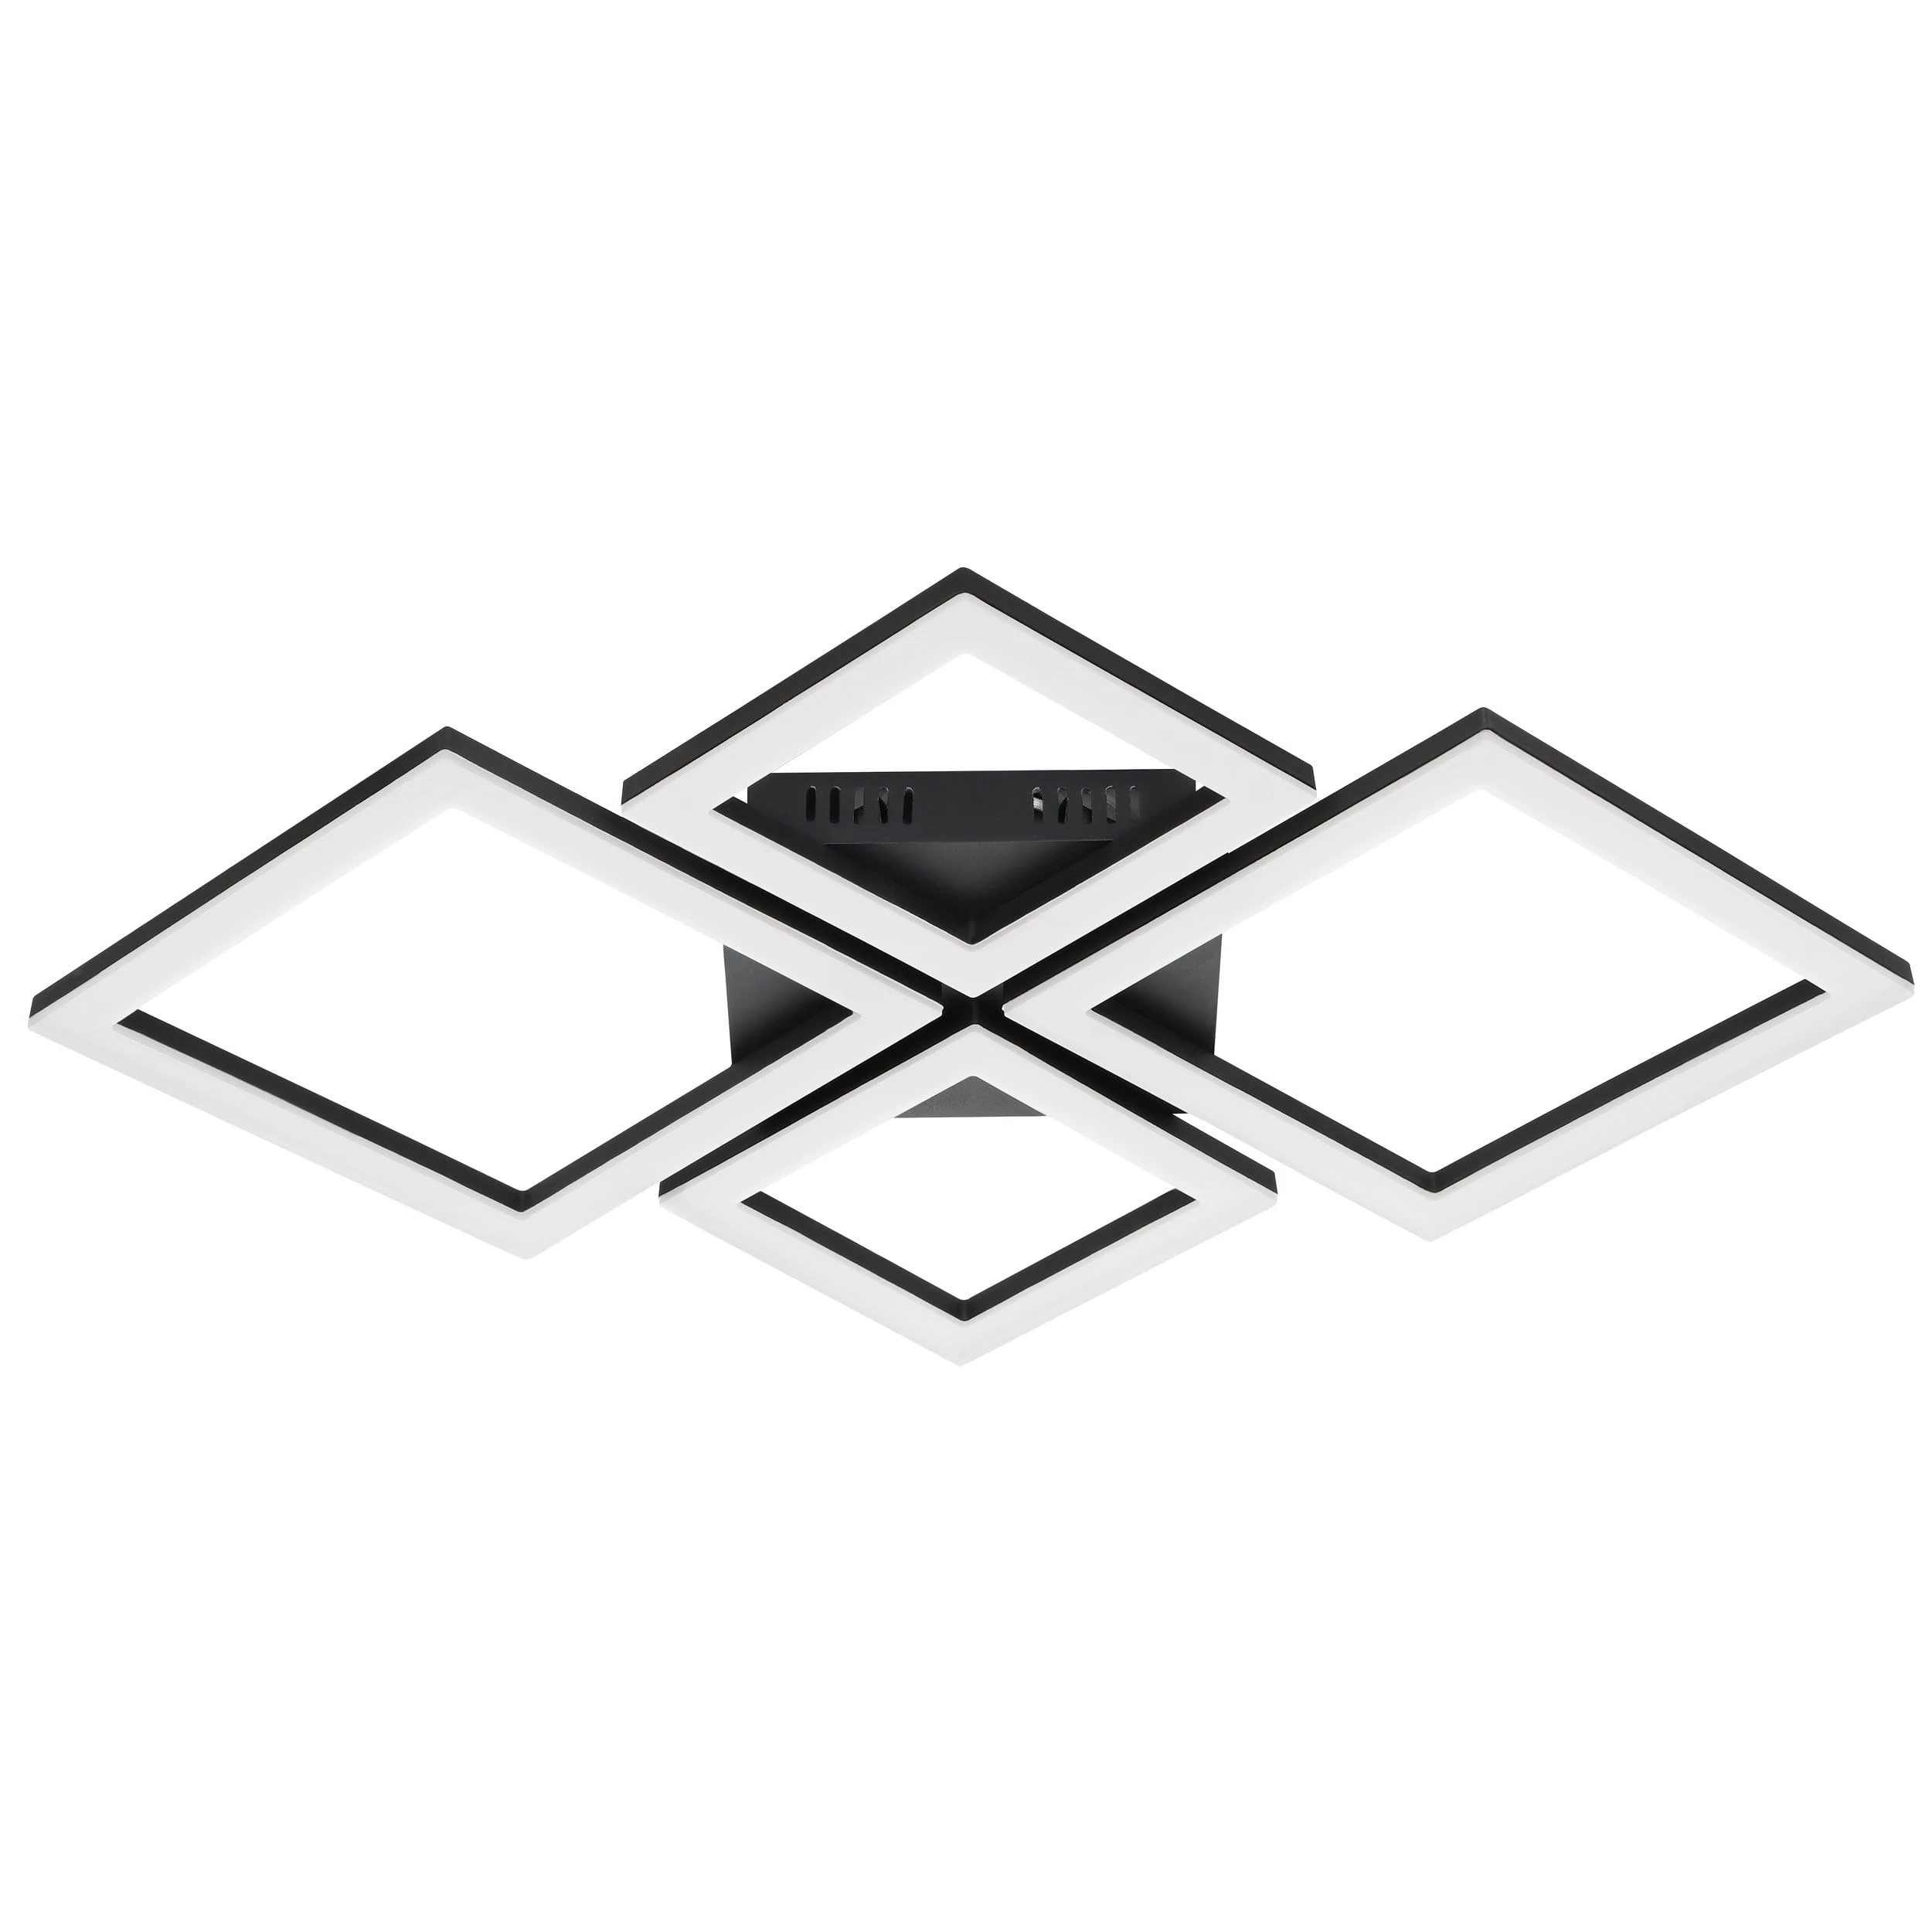
Eglo Connect.z Smart Home LED Ceiling lamp Paranday-Z, 4 Light Zigbee Lighting, app and Voice Control Alexa, tunable White (Warm - Cool White), dimmable Spotlight, Black White, 19 x 17 in
Eglo
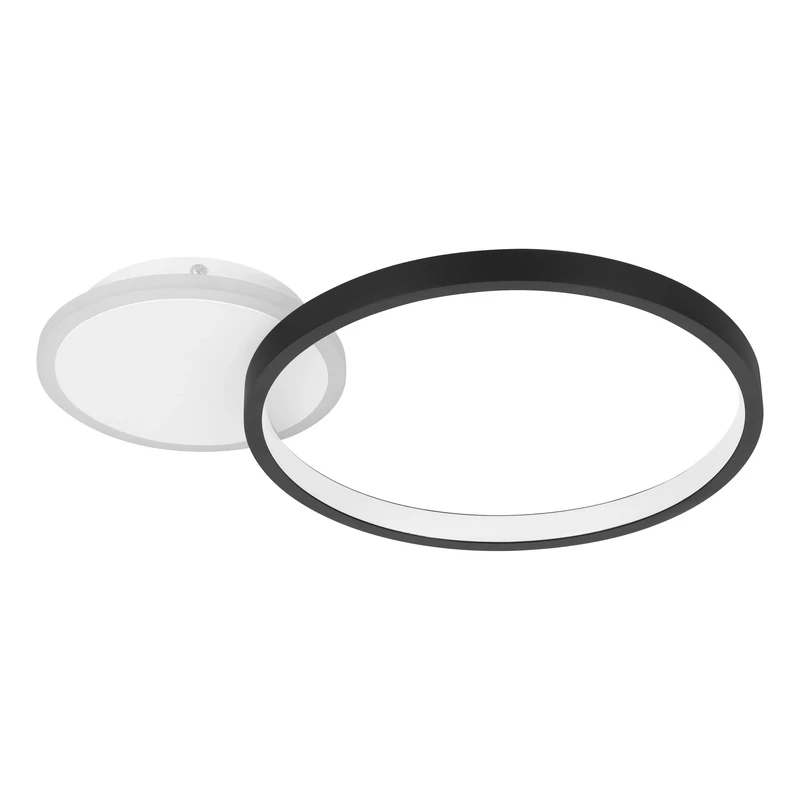
Eglo LED Ceiling spot Gafares, dimmable Ceiling Light Fitting with Remote Control, Round Living Room lamp Made of Black Aluminium and Steel in White and Black, Warm-Cool White
Eglo
Eglo Connect.z Smart Home LED Ceiling lamp Paranday-Z, 2 Light Zigbee Lighting, app and Voice Control Alexa, tunable White (Warm - Cool White), dimmable Spotlight, Black White, 21 x 12 in
Eglo