We can't find the internet
Attempting to reconnect
Something went wrong
Hang in there while we get back on track
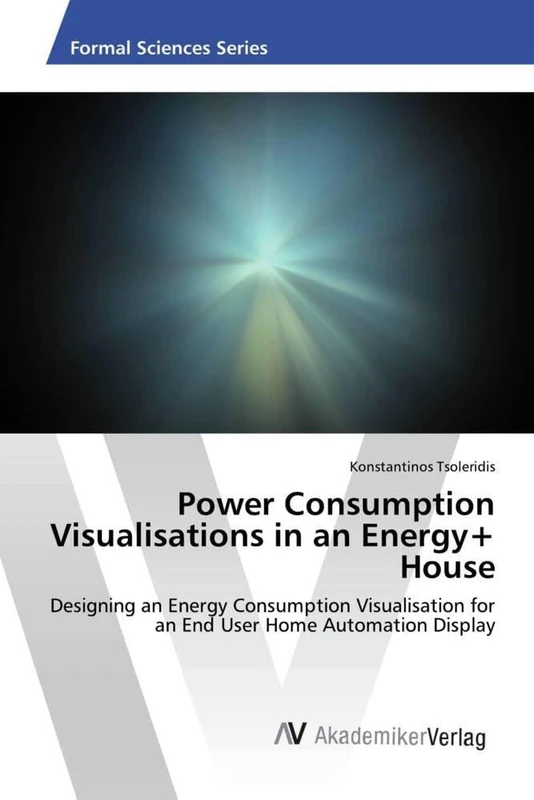
£44.00
It has never been this cheap. We have no record of a lower price.
£44 today · cheaper than every other day in the last 3 months
AV Akademikerverlag Power Consumption Visualisations in an Energy+ House: Designing an Energy Consumption Visualisation for an End User Home Automation Display
48660161
Price data last checked 21 day(s) ago - will refresh soon
We'll watch every seller, every day. One email when your price arrives.
Price History & Forecast
Grey patches = out of stock. Cheaper = lower on the chart. Hover for exact prices.
Last 70 days · 70 data points (no recent data)
48660161
Price data last checked 21 day(s) ago - will refresh soon
NEW HERE?
Amazon shows you one price. We show you all of them.
Tosheroon watches Amazon prices so you don't have to. Every product on Amazon has a price history — we make it visible. Set the price you'd actually pay, and we'll email you the second it gets there. No app, no account, one email.
WHAT'S ON THIS PAGE
when this has been cheap or pricey
where the price is heading next
all-time high & low, recent range
name your number, we'll email you
Price Distribution
Price distribution over 70 days • 1 price levels
Price Analysis
Most common price: £44 (70 days, 100.0%)
Price range: £44 - £44
Price levels: 1 different prices over 70 days
Description
Product Specifications
- Brand
- AV Akademikerverlag
- Model
- 48660161
- Format
- paperback
- ASIN
- 3330500999
- Category
- Books > Subjects
- Domain
- Amazon UK
- Release Date
- 07 June 2017
- Listed Since
- 03 July 2017
Barcode
No barcode data available
Similar Products You Might Like
Diffusion of Innovative Energy Services: Consumers’ Acceptance and Willingness to Pay
Elsevier
Optimum Choice of Energy System Configuration and Storages for a Proper Match between Energy Conversion and Demands
MDPI AG

Towards Future Smart Power Systems with High Penetration of Renewables: Emerging Technologies, New Tools, and Case Studies
Elsevier
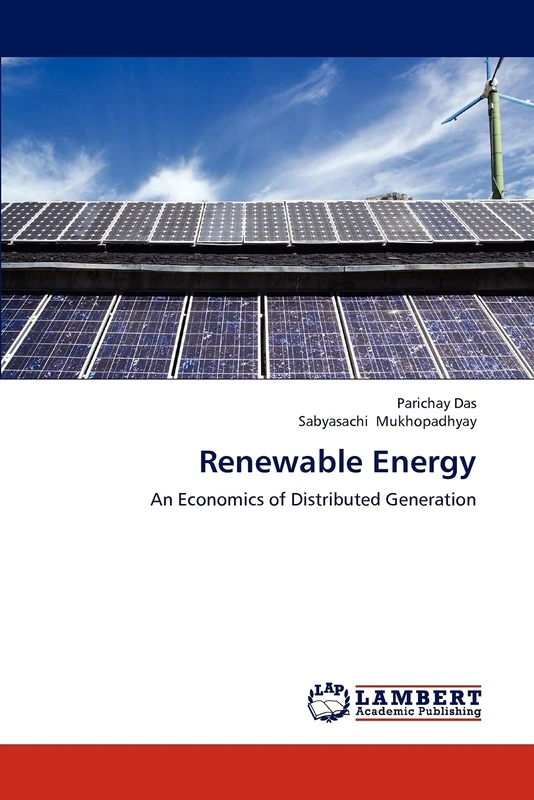
Renewable Energy: An Economics of Distributed Generation
LAP Lambert Academic Publishing
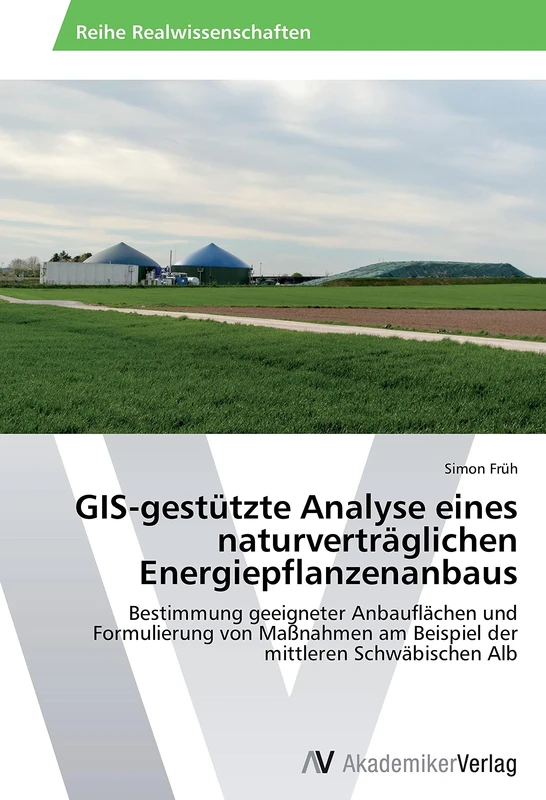
GIS-gestützte Analyse eines naturverträglichen Energiepflanzenanbaus: Bestimmung geeigneter Anbauflächen und Formulierung von Maßnahmen am Beispiel der mittleren Schwäbischen Alb
VDM Verlag