We can't find the internet
Attempting to reconnect
Something went wrong!
Hang in there while we get back on track
£45.65
Stock Market Investing for Beginners: 2 Books in 1, Charting and Technical Analysis+ Cryptocurrency Investing
Price data last checked 40 day(s) ago - refreshing...
We'll watch every seller, every day. One email when your price arrives.
It has never been this cheap. We have no record of a lower price.
£46 today · cheaper than every other day in the last 3 months
NEW HERE?
Amazon shows you one price. We show you all of them.
Tosheroon watches Amazon prices so you don't have to. Every product on Amazon has a price history — we make it visible. Set the price you'd actually pay, and we'll email you the second it gets there. No app, no account, one email.
WHAT'S ON THIS PAGE
when this has been cheap or pricey
where the price is heading next
all-time high & low, recent range
name your number, we'll email you
Price History & Forecast
Grey patches = out of stock. Cheaper = lower on the chart. Hover for exact prices.
Last 51 days • 51 data points (No recent data available)
Price Distribution
Price distribution over 51 days • 1 price levels
Price Analysis
Most common price: £46 (51 days, 100.0%)
Price range: £46 - £46
Price levels: 1 different prices over 51 days
Description
Product Specifications
- Format
- hardcover
- ASIN
- 1803036672
- Domain
- Amazon UK
- Release Date
- 26 January 2023
- Listed Since
- 23 April 2022
Barcode
No barcode data available
Similar Products You Might Like
Day Trading: Strategies To Greatly Maximize Your Profits And Avoid Losses: Volume 5 (Day Trading Bible)
CREATESPACE
The Practical Guide to Trading: Understand the Financial Markets like a Professional (Traders Pathway)
A Complete Guide To Volume Price Analysis: Read The Book Then Read The Market
The Liberated Stock Trader: A Complete Stock Market Education
CREATESPACE

Sportaktien - eine lohnende Investition?
diplom.de
Ce qui marche à Wall Street: Le guide des stratégies d'investissement les plus performantes de tous les temps
VALOR
What professional traders really use. Price action: Read charts like a professional: candlesticks, patterns, price cycles. Professional trading ... Understanding market manipulation and news.
Analyse technique: Le guide complet pour les techniciens des marchés.
VALOR
Using Artificial Neural Networks for Timeseries Smoothing and Forecasting: Case Studies in Economics: 979 (Studies in Computational Intelligence, 979)
Springer
Technical Analysis and Chart Interpretations: A Comprehensive Guide to Understanding Established Trading Tactics for Ultimate Profit (Wiley Trading)
Wiley
Encyclopedia of Chart Patterns (Wiley Trading)
Wiley
The New Trading for a Living: Psychology, Discipline, Trading Tools and Systems, Risk Control, Trade Management (Wiley Trading)
Wiley

Intermarket Analysis: Profiting from Global Market Relationships: Profiting from Global Market Relationships: 632 (Wiley Trading)
Wiley
Fundamental Analysis, Behavioral Finance and Technical Analysis on the Stock Market: Theoretical Concepts and Their Practical Synthesis Capabilities
GRIN Verlag

Economic Foundations for Social Complexity Science: Theory, Sentiments, and Empirical Laws: 9 (Evolutionary Economics and Social Complexity Science, 9)
Springer
Vivre du trading: Psychologie, tactiques de trading, money management
VALOR
Algorithmic Pattern Recognition in Day Trading (The Artificial Edge: Quantitative Trading Strategies with Python)

Time-Series Prediction and Applications: A Machine Intelligence Approach: 127 (Intelligent Systems Reference Library, 127)
Springer
Money Method and Mindset: A simplified approach to trading stocks, commodities & forex using Technical Analysis
notionpress.com
Day Trade With AI: Theoretical foundations for discretionary, algorithmic, and diversified trading with AI

Trading: Technical Analysis Masterclass: Master the financial markets
Independently Published
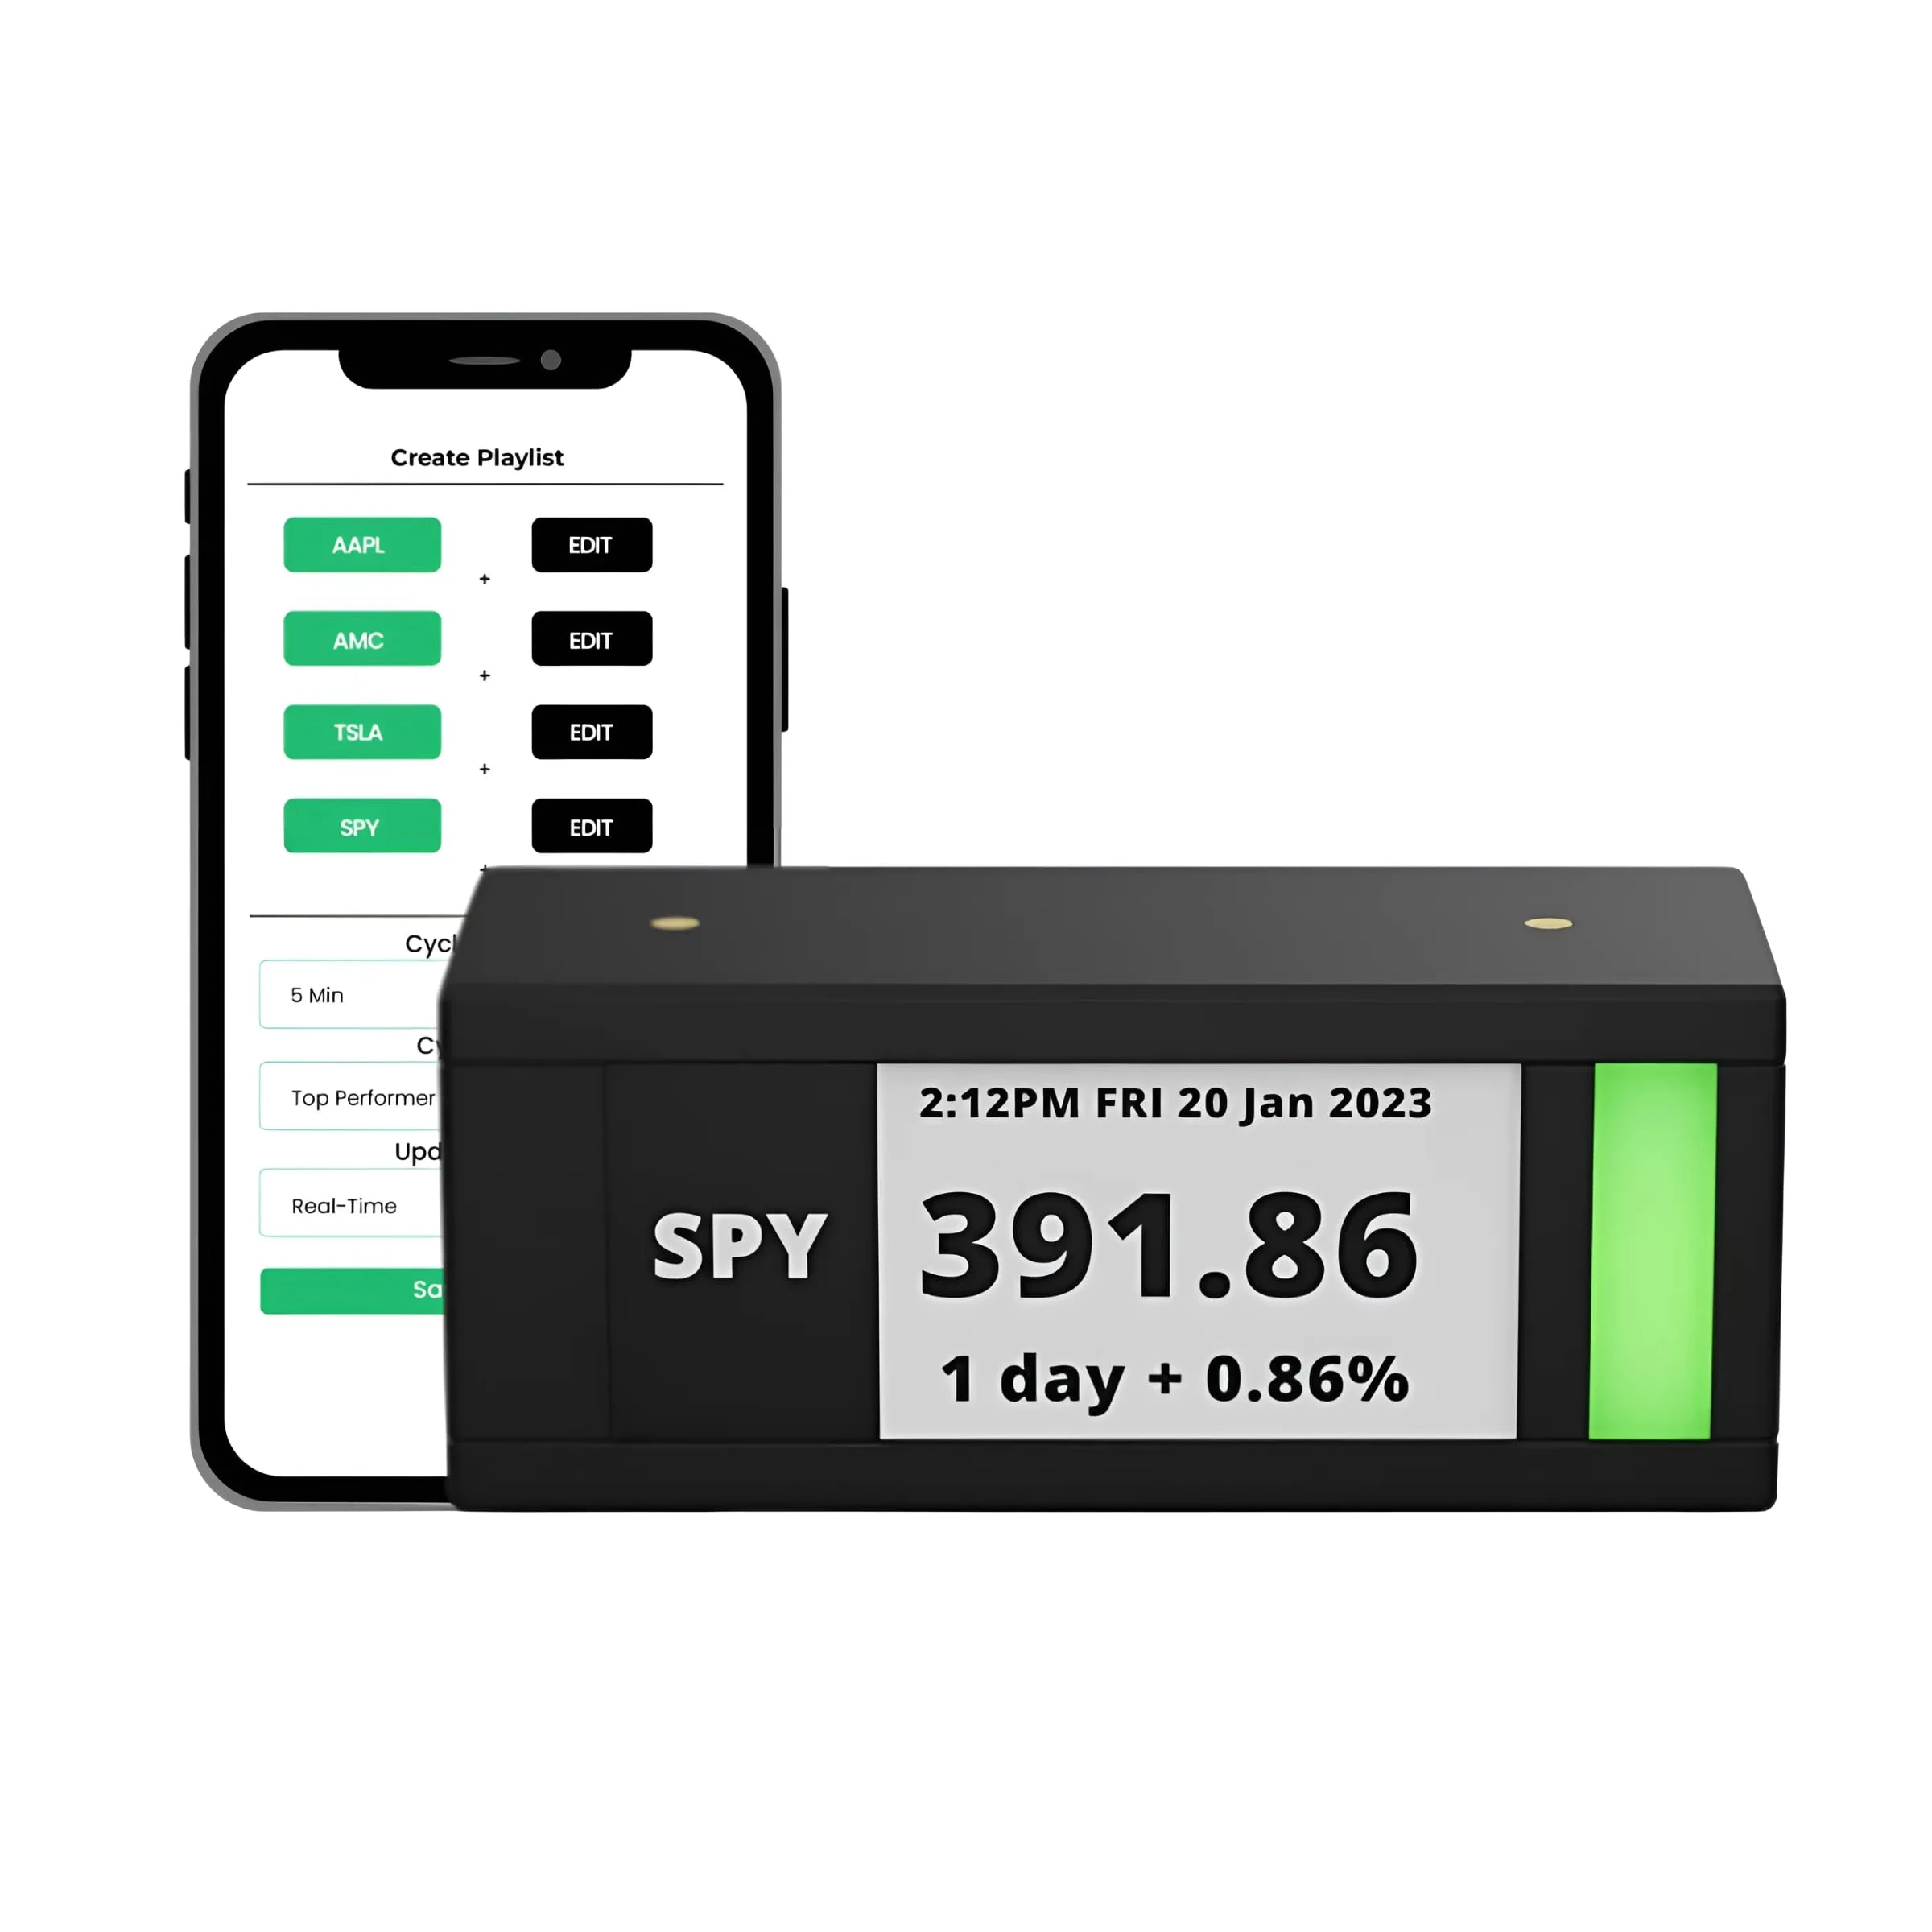
TickrMeter Stock Ticker - 2.9 inch E-Ink WiFi Display
TickrMeter
BOTT Price Action Bible: Binary Options Turbo Trading, Forex, FX Options, Digital Options
Independently Published