We can't find the internet
Attempting to reconnect
Something went wrong
Hang in there while we get back on track
£70.20
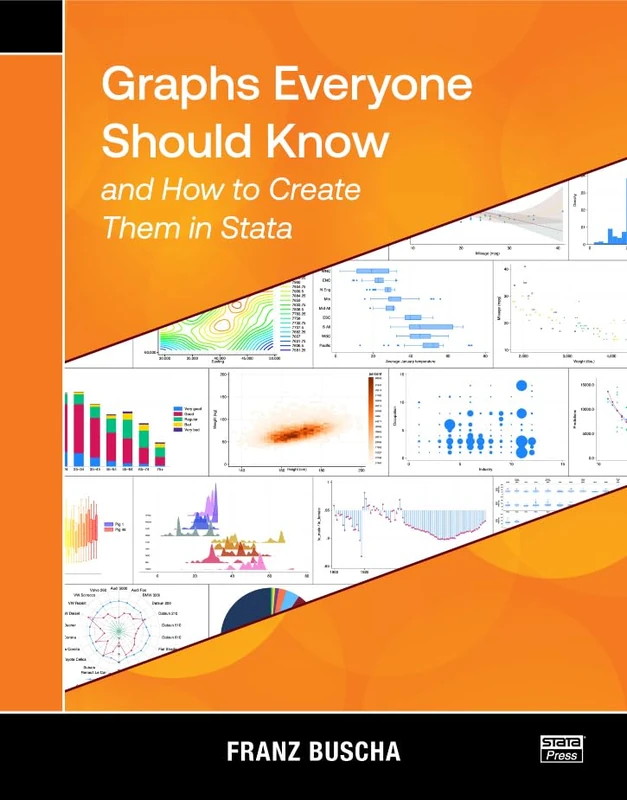
Stata Press Graphs Everyone Should Know and How to Create Them in Stata
Price data checked 1 day ago
We'll watch every seller, every day. One email when your price arrives.
About as cheap as it gets. The only time it was cheaper was 3 months ago.
£70 today · all-time low £70 (Apr 2026) · usually £70
NEW HERE?
Amazon shows you one price. We show you all of them.
Tosheroon watches Amazon prices so you don't have to. Every product on Amazon has a price history — we make it visible. Set the price you'd actually pay, and we'll email you the second it gets there. No app, no account, one email.
WHAT'S ON THIS PAGE
when this has been cheap or pricey
where the price is heading next
all-time high & low, recent range
name your number, we'll email you
Price History & Forecast
Grey patches = out of stock. Cheaper = lower on the chart. Hover for exact prices.
Last 90 days · 90 data points
Price Distribution
Price distribution over 90 days • 1 price levels
Price Analysis
Most common price: £70 (90 days, 100.0%)
Price range: £70 - £70
Price levels: 1 different prices over 90 days
Description
Product Specifications
- Brand
- Stata Press
- Format
- paperback
- ASIN
- 1597184136
- Domain
- Amazon UK
- Release Date
- 29 April 2025
- Listed Since
- 25 February 2025
Barcode
No barcode data available
Similar Products You Might Like
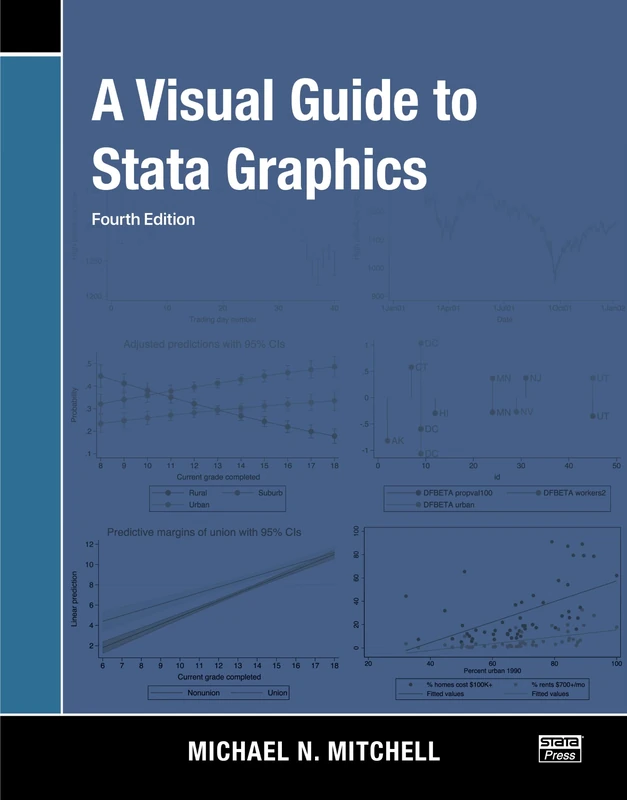
A Visual Guide to Stata Graphics
Taylor & Francis
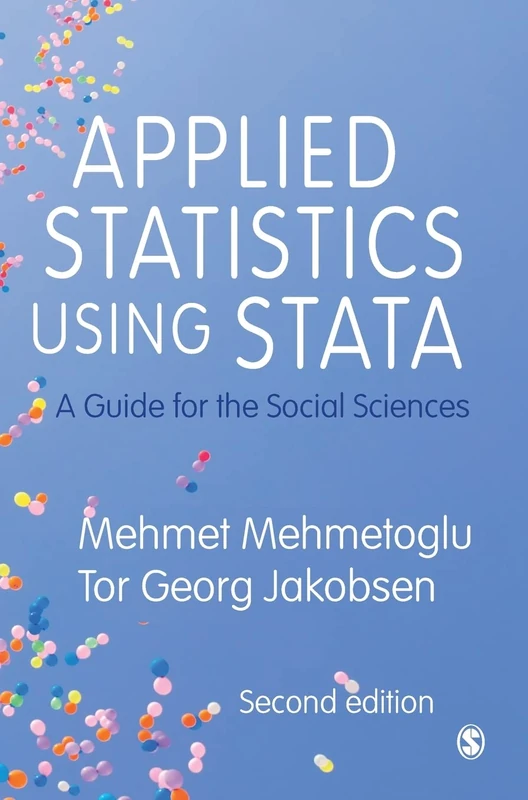
Applied Statistics Using Stata: A Guide for the Social Sciences
Sage Publications
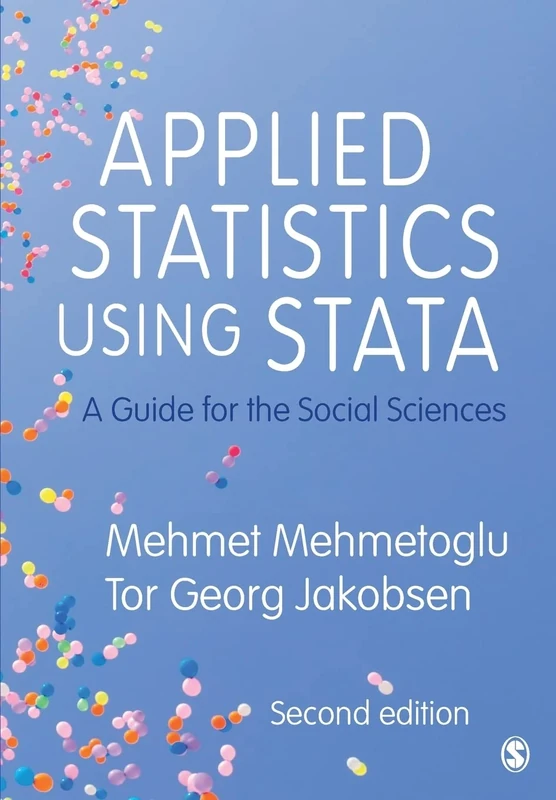
Applied Statistics Using Stata: A Guide for the Social Sciences
Sage Publications
Datenanalyse mit Stata: Allgemeine Konzepte Der Datenanalyse Und Ihre Praktische Anwendung
De Gruyter Oldenbourg
Statistics Using Stata: An Integrative Approach
Cambridge University Press
Handbook of Statistical Analyses Using Stata
CRC Press
A Handbook of Statistical Analyses Using Stata, Fourth Edition
CRC Press
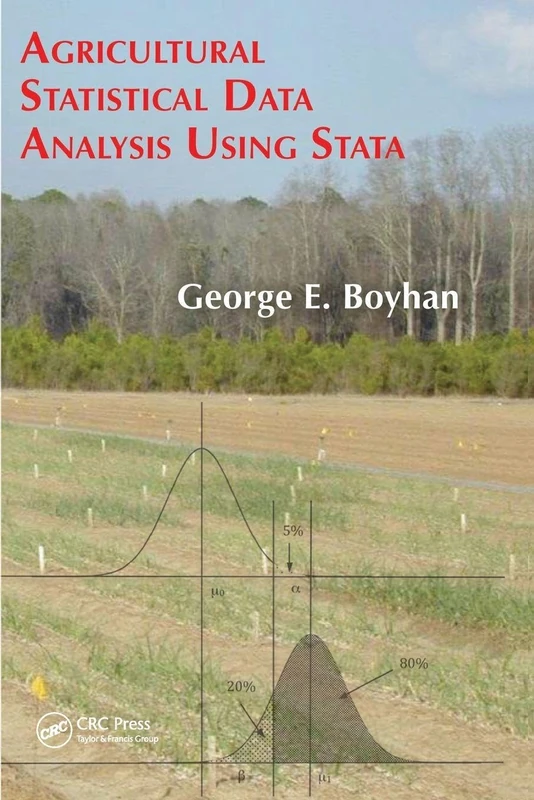
Agricultural Statistical Data Analysis Using Stata
CRC Press
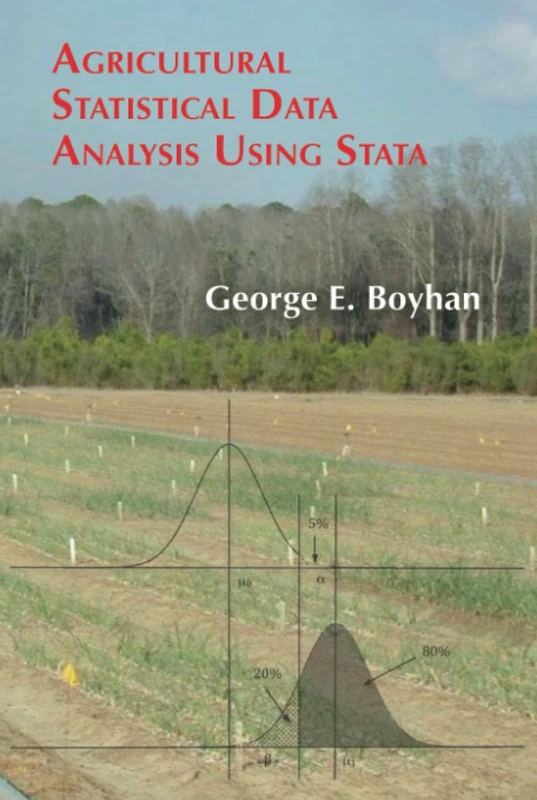
CRC Press Agricultural Statistical Data Analysis Using Stata
CRC Press
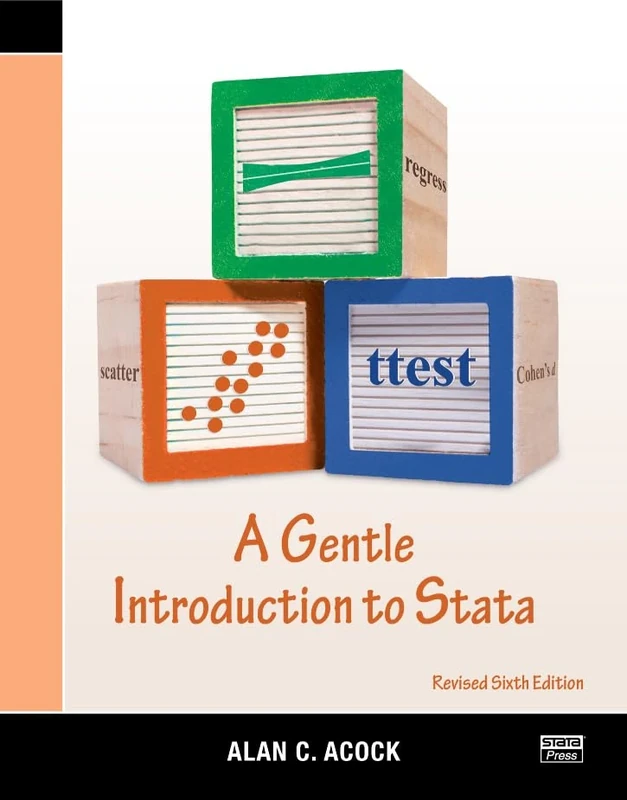
A Gentle Introduction to Stata, Revised Sixth Edition
Taylor & Francis
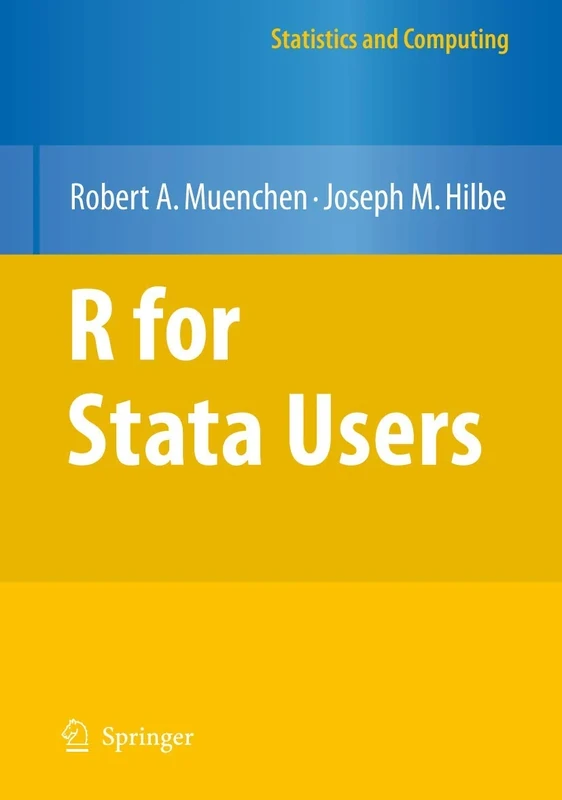
R for Stata Users (Statistics and Computing)
Springer

R for Stata Users (Statistics and Computing)
Springer
Stata Tips, Fourth Edition, Volumes I and II: Tips 1-119 / Tips 120-152: 1-2
Stata Press
A Comprehensive Guide to Coding and Programming in Stata
Chapman and Hall/CRC
Market Research: The Process, Data, and Methods Using Stata (Springer Texts in Business and Economics)
Springer
Market Research: The Process, Data, and Methods Using Stata (Springer Texts in Business and Economics)
Springer
Statistical Analysis of Human Growth and Development: 62 (Chapman & Hall/CRC Biostatistics Series)
CRC Press
Create and Export Tables Using Stata
Stata Press

StataQuest 4 Windows 95 Version
Cengage Learning
An Introduction to Stata Programming, Second Edition
Taylor & Francis
Statistical Computing: An Introduction to Data Analysis using S-Plus
Wiley
An Introduction to Stata for Health Researchers
Taylor & Francis
Statistical Analysis of Human Growth and Development (Chapman & Hall/CRC Biostatistics Series)
CRC Press
R for Statistics
CRC Press