We can't find the internet
Attempting to reconnect
Something went wrong
Hang in there while we get back on track
£37.09
O'Reilly R Graphics Cookbook 2e: Practical Recipes for Visualizing Data
Price data last checked 43 day(s) ago - refreshing...
We'll watch every seller, every day. One email when your price arrives.
It has never been this cheap. We have no record of a lower price.
£37 today · cheaper than every other day in the last 3 months
NEW HERE?
Amazon shows you one price. We show you all of them.
Tosheroon watches Amazon prices so you don't have to. Every product on Amazon has a price history — we make it visible. Set the price you'd actually pay, and we'll email you the second it gets there. No app, no account, one email.
WHAT'S ON THIS PAGE
when this has been cheap or pricey
where the price is heading next
all-time high & low, recent range
name your number, we'll email you
Price History & Forecast
Grey patches = out of stock. Cheaper = lower on the chart. Hover for exact prices.
Last 48 days · 48 data points (no recent data)
Price Distribution
Price distribution over 48 days • 2 price levels
Price Analysis
Most common price: £38 (33 days, 68.8%)
Price range: £37 - £38
Price levels: 2 different prices over 48 days
Description
Key Features
New Store Stock
Product Specifications
- Brand
- O'Reilly
- Format
- paperback
- ASIN
- 1491978600
- Domain
- Amazon UK
- Release Date
- 06 November 2018
- Listed Since
- 19 September 2017
Barcode
No barcode data available
Similar Products You Might Like
ggplot2: Elegant Graphics for Data Analysis (Use R!)
Springer
R Programming: This book includes: R Basics for Beginners + R Data Analysis and Statistics + R Data Visualization: 4
R Visualizations: Derive Meaning from Data
CRC Press
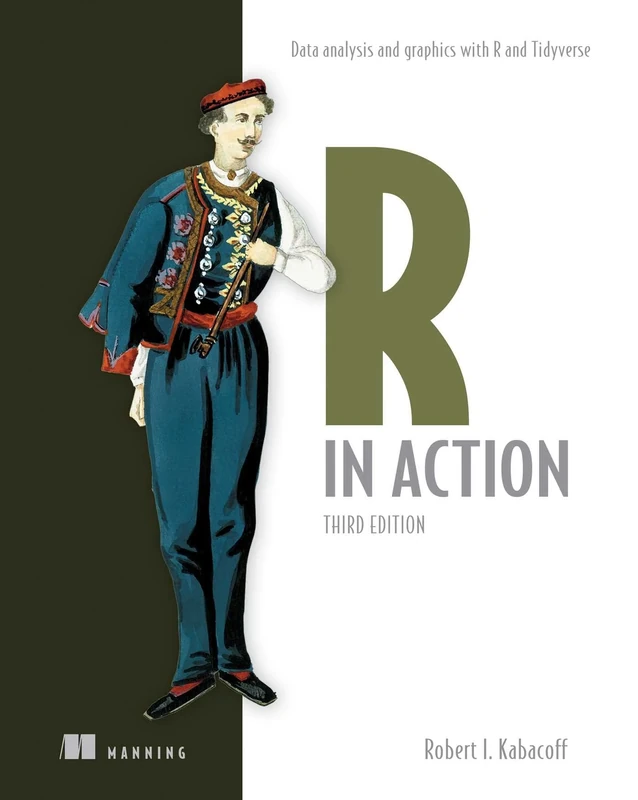
R in Action: Data Analysis and Graphics with R and Tidyverse
Manning
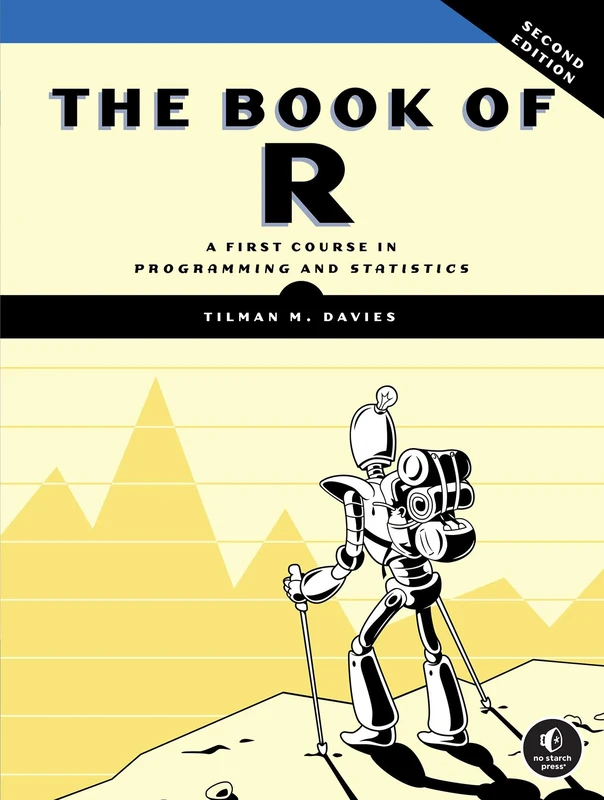
The Book of R, 2nd Edition A First Course in Programming and Statistics
No Starch Press
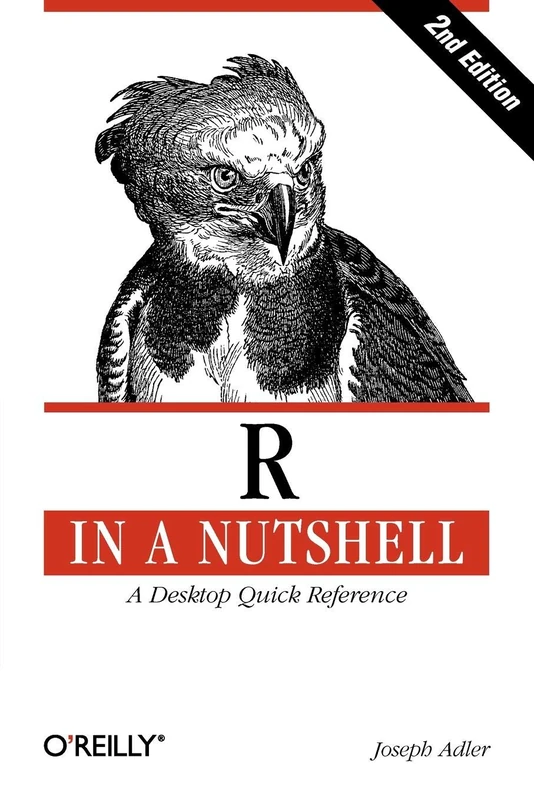
R in a Nutshell 2e: A Desktop Quick Reference (In a Nutshell (O'Reilly))
O'Reilly

An Introduction to R for Non-Programmers
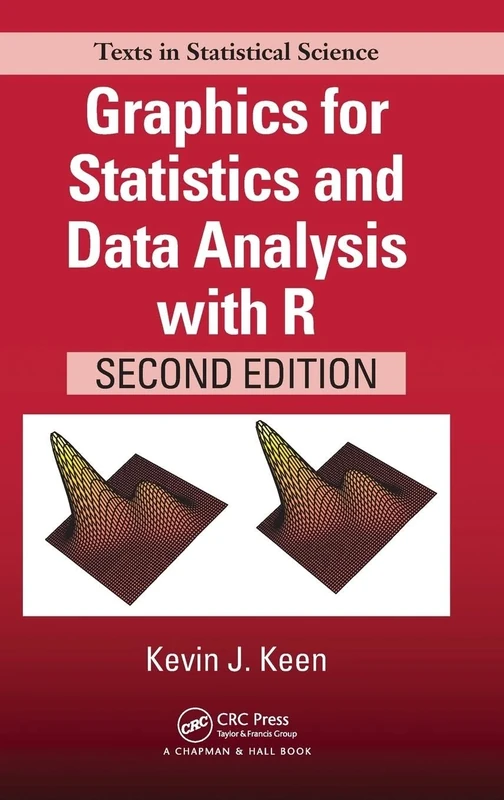
Graphics for Statistics and Data Analysis with R: Graphics for Statistics and Data Analysis with R (Chapman & Hall/CRC Texts in Statistical Science)
CRC Press
Data Visualisation with R: 111 Examples
Springer
Programming Graphical User Interfaces in R (Chapman & Hall/CRC The R Series)
CRC Press
R Graphics, Third Edition (Chapman & Hall/CRC The R Series)
CRC Press
Advanced Analytics in Power BI with R and Python: Ingesting, Transforming, Visualizing
Apress
Getting Started with R: An Introduction for Biologists
Oxford University Press
Data Visualisation with R: 111 Examples
Springer
Getting Started with R: An Introduction for Biologists
Oxford University Press
R Graphics, Third Edition (Chapman & Hall/CRC The R Series)
CRC Press
Data Science with Julia
CRC Press
Learn ggplot2 Using Shiny App (Use R!)
Springer
Getting (more out of) Graphics: Practice and Principles of Data Visualisation (Chapman & Hall/CRC Data Science Series)
Chapman and Hall/CRC
Graphing Data: Techniques for Display and Analysis: 36 (Applied Social Research Methods)
Sage Publications
Graphing Data: Techniques for Display and Analysis: 36 (Applied Social Research Methods)
Sage Publications
Sage Publications Graphing Statistics & Data - Better Charts
Sage Publications
The Grammar of Graphics (Statistics and Computing)
Springer
Interactive Web-Based Data Visualization with R, plotly, and shiny (Chapman & Hall/CRC The R Series)
CRC Press