We can't find the internet
Attempting to reconnect
Something went wrong
Hang in there while we get back on track
£100.00
CRC Press Visualizing Baseball (ASA-CRC Series on Statistical Reasoning in Science and Society)
Price data last checked 41 day(s) ago - refreshing...
We'll watch every seller, every day. One email when your price arrives.
It has never been this cheap. We have no record of a lower price.
£100 today · cheaper than every other day in the last 3 months
NEW HERE?
Amazon shows you one price. We show you all of them.
Tosheroon watches Amazon prices so you don't have to. Every product on Amazon has a price history — we make it visible. Set the price you'd actually pay, and we'll email you the second it gets there. No app, no account, one email.
WHAT'S ON THIS PAGE
when this has been cheap or pricey
where the price is heading next
all-time high & low, recent range
name your number, we'll email you
Price History & Forecast
Grey patches = out of stock. Cheaper = lower on the chart. Hover for exact prices.
Last 50 days · 50 data points (no recent data)
Price Distribution
Price distribution over 50 days • 2 price levels
Price Analysis
Most common price: £100 (35 days, 70.0%)
Price range: £100 - £133
Price levels: 2 different prices over 50 days
Description
Product Specifications
- Brand
- CRC Press
- Format
- hardcover
- ASIN
- 1138551155
- Domain
- Amazon UK
- Release Date
- 02 November 2017
- Listed Since
- 08 June 2017
Barcode
No barcode data available
Similar Products You Might Like
The Cooperstown Symposium on Baseball and American Culture, 2011-2012 (Cooperstown Symposium Series): 11
McFarland

Teaching Statistics Using Baseball (MAA Textbooks)

Seams and Dreams
IngramSpark
Scarecrow Press Historical Dictionary of Baseball Reference
Scarecrow Press

Baseball/Literature/Culture: Essays, 2004-2005: 3 (Baseball in Literature and American Culture Conference Series, 3)
McFarland
Touching All the Bases: Baseball in 101 Fascinating Stories
Scarecrow Press
Baseball and American Culture: Across the Diamond (Contemporary Sports Issues)
Routledge
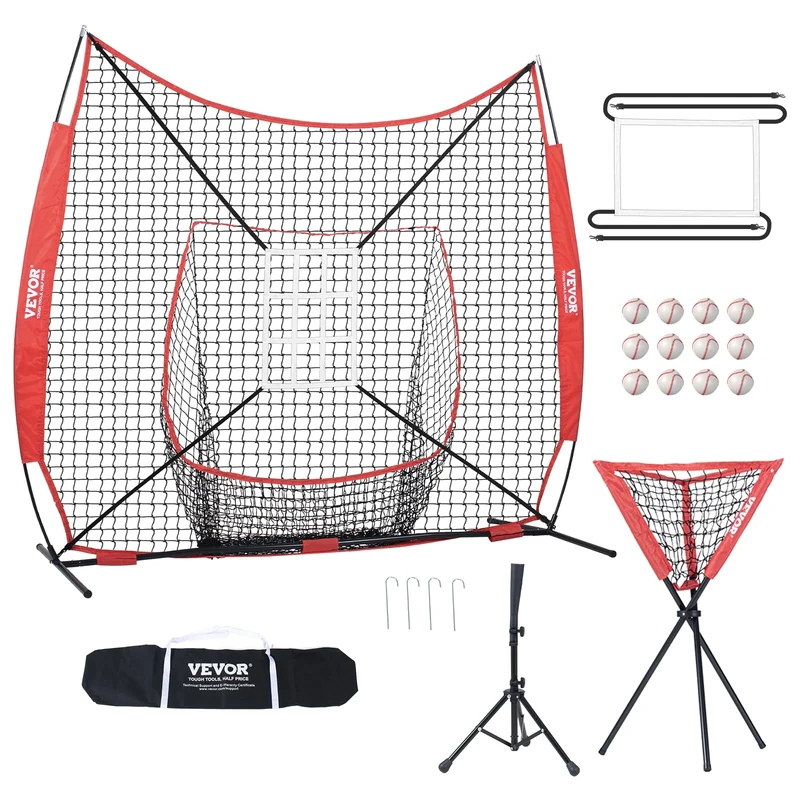
VEVOR 7x7 ft Baseball Softball Practice Net, Portable Baseball Training Net for Hitting Catching Pitching, Backstop Equipment with Bow Frame, Carry Bag, Strike Zone, 12 Balls, Tee, and Ball Collector
VEVOR
Price unavailable
Champro Men's Triple Crown 2.0 Open Bottom Baseball Pants
Champro
America's Game: A History of Major League Baseball through World War II
Rowman & Littlefield Publishers

Champro Men's Triple Crown 2.0 Open Bottom Baseball Pants
Champro

Champro Men's Triple Crown 2.0 Open Bottom Baseball Pants
Champro

Champro Men's Triple Crown 2.0 Open Bottom Baseball Pants
Champro
Analytic Methods in Sports: Using Mathematics and Statistics to Understand Data from Baseball, Football, Basketball, and Other Sports
CRC Press
Champion Sports Leather Softball Pack
Champion Sports
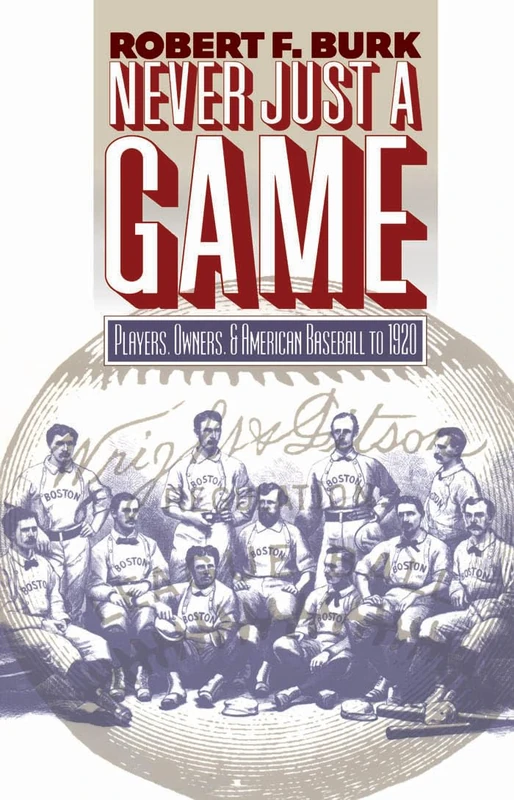
Never Just a Game: Players, Owners and American Baseball to 1920
University of North Carolina Press
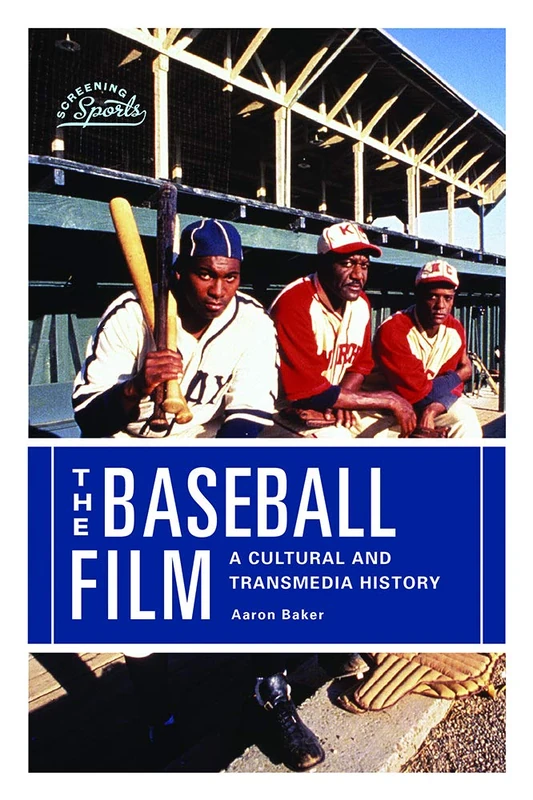
Rutgers University Press - The Baseball Film History Book
Rutgers University Press

Baseball. Ein Konzept für die Schule
GRIN Verlag

Springer Frontiers in Major League Baseball - DEA Analysis Book
Springer
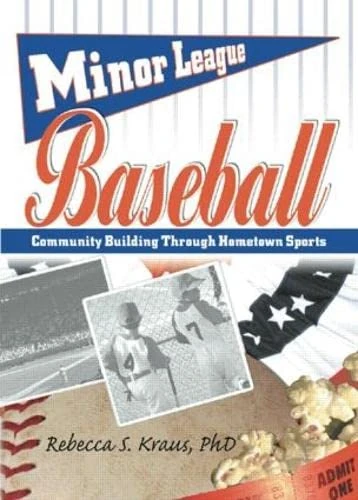
Routledge Minor League Baseball: Community Building Book
Routledge

The Team America Loves to Hate: Why Baseball Fans Despise the New York Yankees
Praeger
The Softball Coaching Bible, Volume I
Human Kinetics